
Serverless applications are not “No Ops”, despite the meme. 🙄
Monitoring runtime metrics is still crucial for serverless applications. Identifying, diagnosing and resolving issues in production requires data on execution durations, errors thrown, resource usage statistics amongst other metrics.
IBM Cloud has a comprehensive series of tools for monitoring application metrics. In this blog post series, we’re going to look at using these tools to monitor metrics from serverless applications. 💯💯💯
overview
We’ll start with understanding how to capture metrics from IBM Cloud Functions (Apache OpenWhisk) applications. Then we’ll look at methods for automatically sending metric values into the IBM Cloud Monitoring service. Once metric data is being captured, we’ll explore Grafana to create dashboards to monitor data values in real-time. Finally, we’ll look at configuring alerting services to notify us when issues occur.
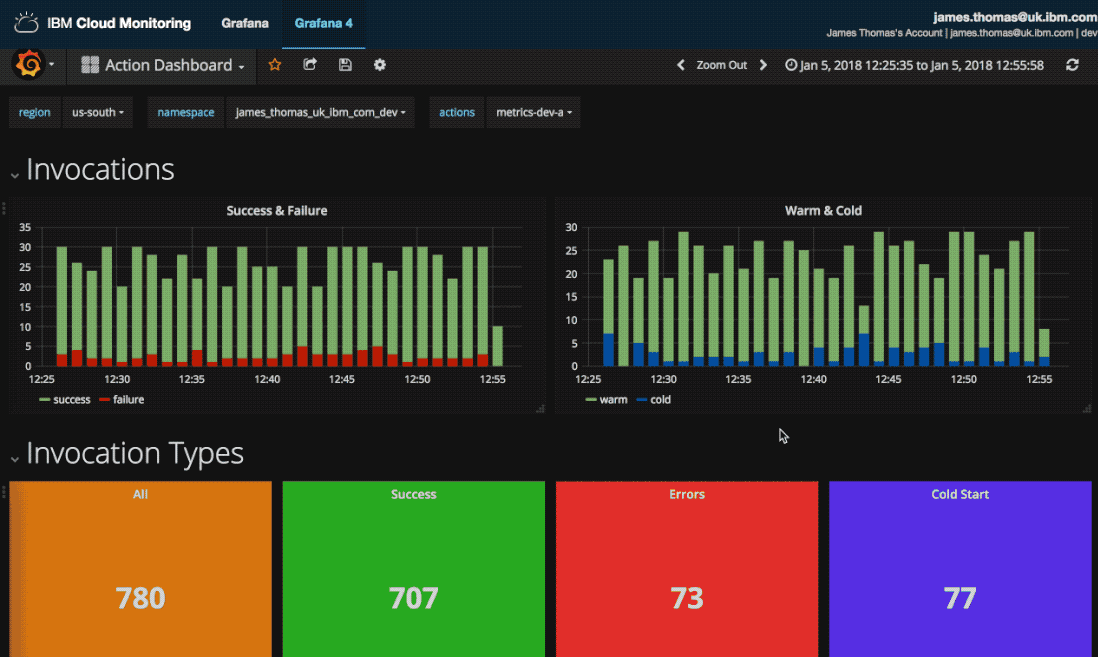
Here’s a sneak peak of some of the dashboards we’ll be creating from serverless application metrics…
blog posts
Here are the links to the blog posts in the series…
- Part 1: Capturing Runtime Metrics For OpenWhisk Applications
- Part 2: Visualising Serverless Metrics With Grafana Dashboards
- Part 3: Configuring Alert Notifications Based on Metric Rules
You can start now with the first blog post, other blog posts will follow soon….
tldr?
pssst. want to set this up without reading all those boring words and stuff?
Here are the links to the open-source libraries used to set this up. Follow the instructions in the repositories to enable capturing and forwarding metrics to the monitoring service.
Here are the JSON configuration files for the Grafana dashboards.
https://gist.github.com/jthomas/47466693e88d0407c239535624222e6b
Import these files to create new dashboards and add the following template variables.
- $region => ibm.public.cloud-functions.*
- $namespace => ibm.public.cloud-functions.$region.*
- $actions => ibm.public.cloud-functions.$region.$namespace.*