
Debugging serverless applications is one of the most challenging issues developers face when using serverless platforms. How can you use debugging tools without any access to the runtime environment?
Last week, I worked out how to expose the Node.js debugger in the Docker environment used for the application runtime in Apache OpenWhisk.
Want to use Node.js debugger for @openwhisk actions? Start runtime container locally with this command to expose v8 inspector.
— James Thomas (@thomasj) June 30, 2018
$ docker run -p 8080:8080 -p 9229:9229 -it openwhisk/action-nodejs-v8 node --inspect=0.0.0.0:9229 app.js
Then connect Chrome Dev Tools or @code. 💯 pic.twitter.com/X4i01QEOmg
Using the remote debugging service, we can set breakpoints and step through action handlers live, rather than just being reliant on logs and metrics to diagnose bugs.
So, how does this work?
Let’s find out more about how Apache OpenWhisk executes serverless functions…
Background
Apache OpenWhisk is the open-source serverless platform which powers IBM Cloud Functions. OpenWhisk uses Docker containers to create isolated runtime environments for executing serverless functions.
Containers are started on-demand as invocation requests arrive. Serverless function source files are dynamically injected into the runtime and executed for each invocation. Between invocations, containers are paused and kept in a cache for re-use with further invocations.
The benefit of using an open-source serverless platform is that the build files used to create runtime images are also open-source. OpenWhisk also automatically builds and publishes all runtime images externally on Docker Hub. Running containers using these images allows us to simulate the remote serverless runtime environment.
Runtime Images
All OpenWhisk runtime images are published externally on Docker Hub.
Runtime images start a HTTP server which listens on port 8080. This HTTP server must implement two API endpoints (/init & /run) accepting HTTP POST requests. The platform uses these endpoints to initialise the runtime with action code and then invoke the action with event parameters.
More details on the API endpoints can be found in this blog post on creating Docker-based actions.
Node.js Runtime Image
This repository contains the source code used to create Node.js runtime environment image.
https://github.com/apache/incubator-openwhisk-runtime-nodejs
Both Node.js 8 and 6 runtimes are built from a common base image. This base image contains an Express.js server which handles the platform API requests. The app.js file containing the server is executed when the containers starts.
JavaScript code is injected into the runtime using the /init API. Actions created from source code are dynamically evaluated to instantiate the code in the runtime. Actions created from zip files are extracted into a temporary directory and imported as a Node.js module.
Once instantiated, actions are executed using the /run API. Event parameters are come from the request body. Each time a new request is received, the server calls the action handler with event parameters. Returned values are serialised as the JSON body in the API response.
Starting Node.js Runtime Containers
Use this command to start the Node.js runtime container locally.
$ docker run -it -p 8080:8080 openwhisk/action-nodejs-v8
Once the container has started, port 8080 on localhost will be mapped to the HTTP service exposed by the runtime environment. This can be used to inject serverless applications into the runtime environment and invoke the serverless function handler with event parameters.
Node.js Remote Debugging
Modern versions of the Node.js runtime have a command-line flag (--inspect) to expose a remote debugging service. This service runs a WebSocket server on localhost which implements the Chrome DevTools Protocol.
$ node --inspect index.js
Debugger listening on 127.0.0.1:9229.
External tools can connect to this port to provide debugging capabilities for Node.js code.
Docker images for the OpenWhisk Node.js runtimes use the following command to start the internal Node.js process. Remote debugging is not enabled by default.
node --expose-gc app.js
Docker allows containers to override the default image start command using a command line argument.
This command will start the OpenWhisk Node.js runtime container with the remote debugging service enabled. Binding the HTTP API and WebSocket ports to the host machine allows us to access those services remotely.
docker run -p 8080:8080 -p 9229:9229 -it openwhisk/action-nodejs-v8 node --inspect=0.0.0.0:9229 app.js
Once a container from the runtime image has started, we can connect our favourite debugging tools…
Chrome Dev Tools
To connect Chrome Dev Tools to the remote Node.js debugging service, follow these steps.
- Open the following page in Chrome: chrome://inspect/#devices
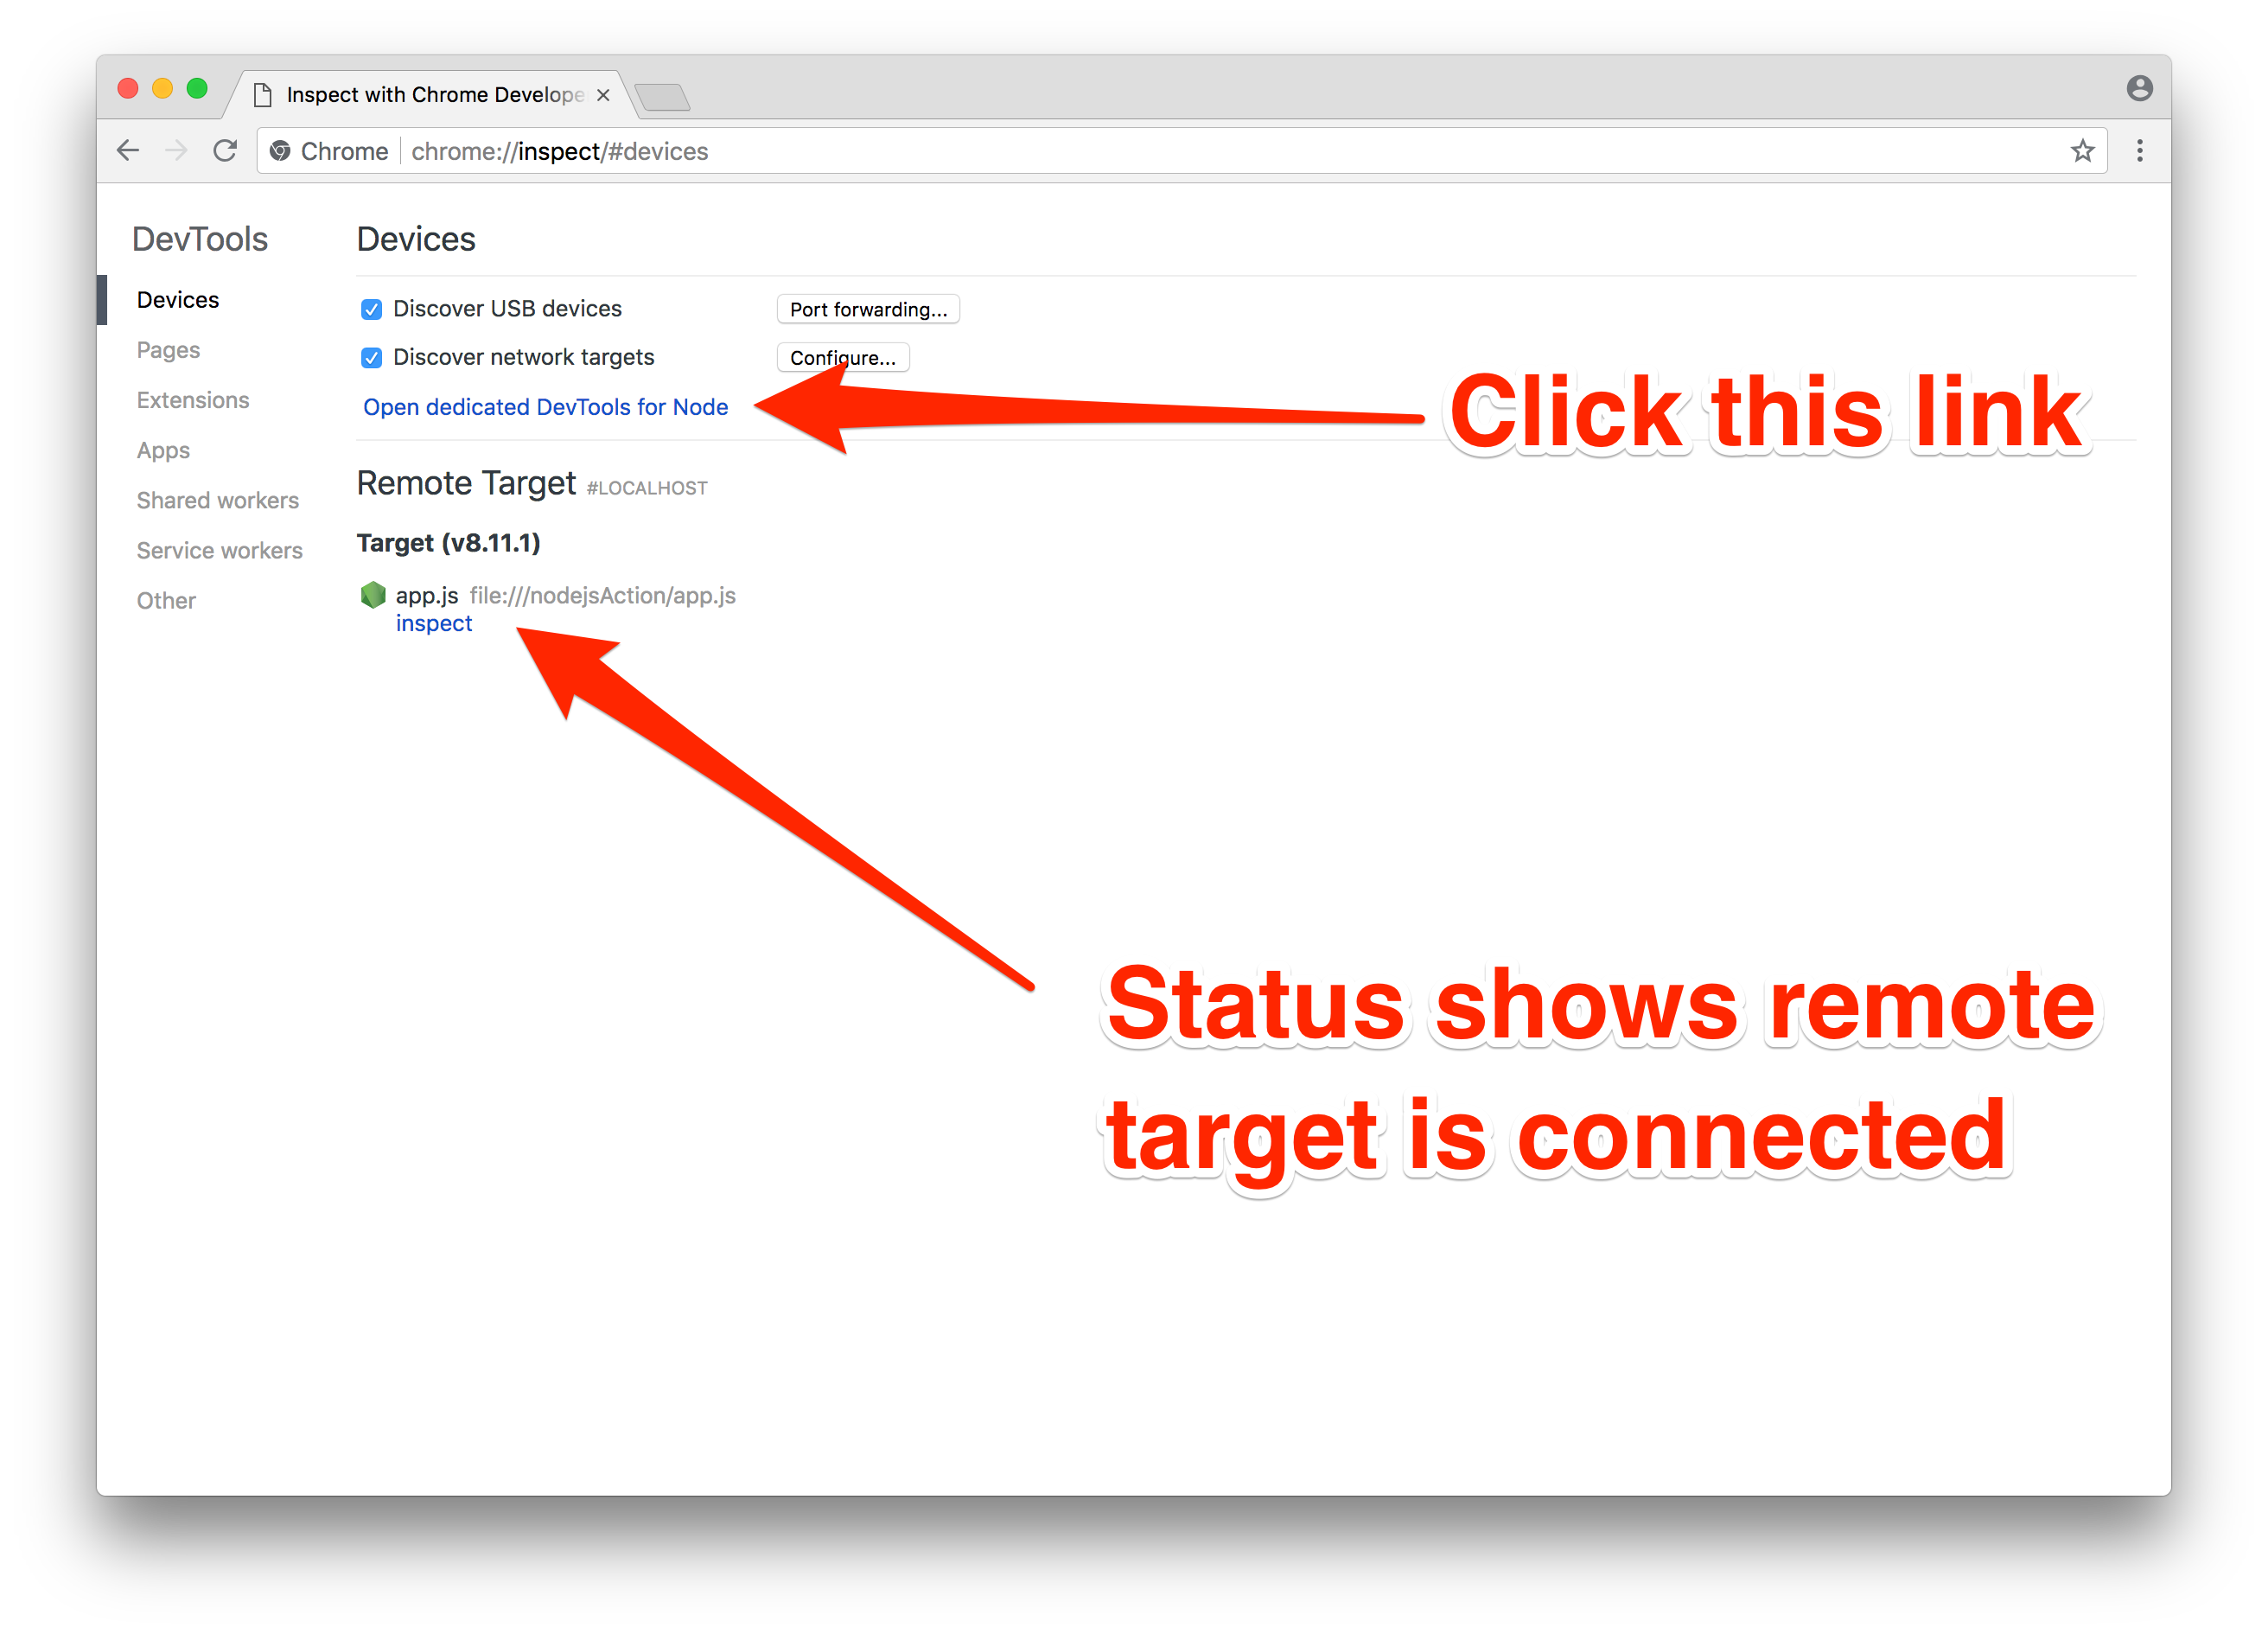
Chrome Dev Tools is configured to open a connection on port 9229 on localhost. If the web socket connection succeeds, the debugging target should be listed in the “Remote Target” section.
- Click the “Open dedicated DevTools for Node” link.
In the “Sources” panel the JavaScript files loaded by the Node.js process are available.
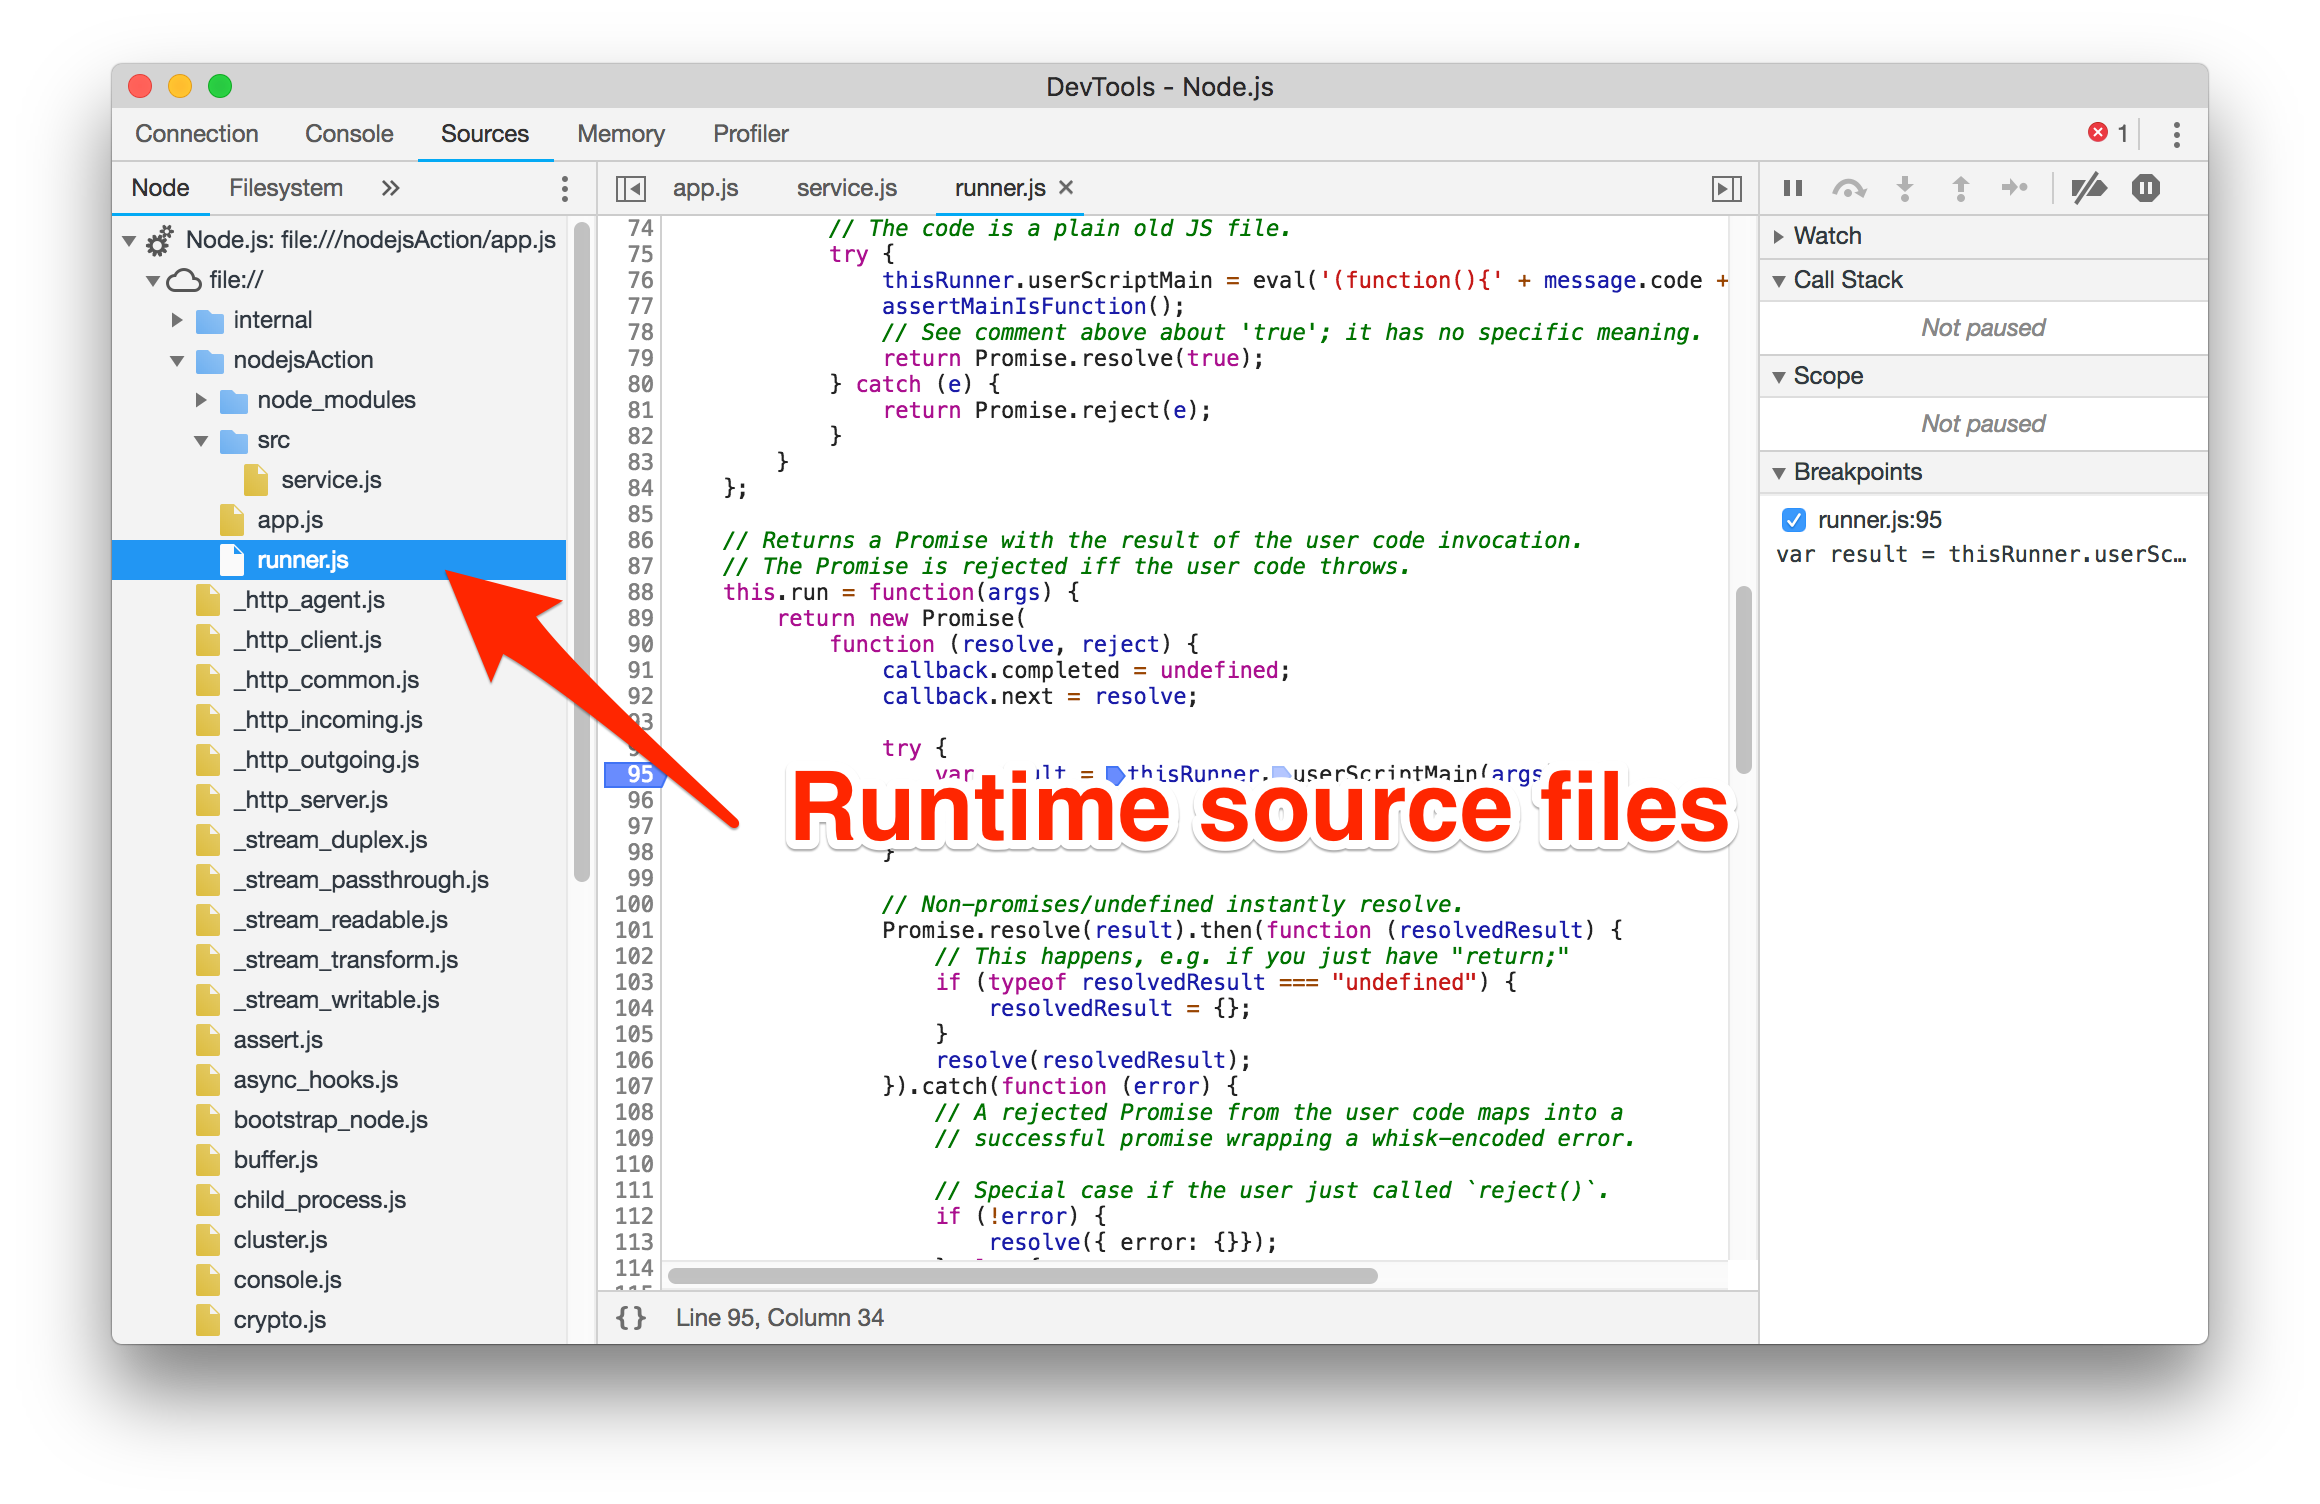
Setting breakpoints in the runner.js file will allow you to halt execution for debugging upon invocations.
VSCode
Visual Studio Code supports remote debugging of Node.js code using the Chrome Dev Tools protocol. Follow these steps to connect the editor to the remote debugging service.
- Click the menu item “Debug -> Add Configuration”
- Select the “Node.js: Attach to Remote Program” from the Intellisense menu.
- Edit the default configuration to have the following values.
{
  "type": "node",
  "request": "attach",
  "name": "Attach to Remote",
  "address": "127.0.0.1",
  "port": 9229,
  "localRoot": "${workspaceFolder}"
}
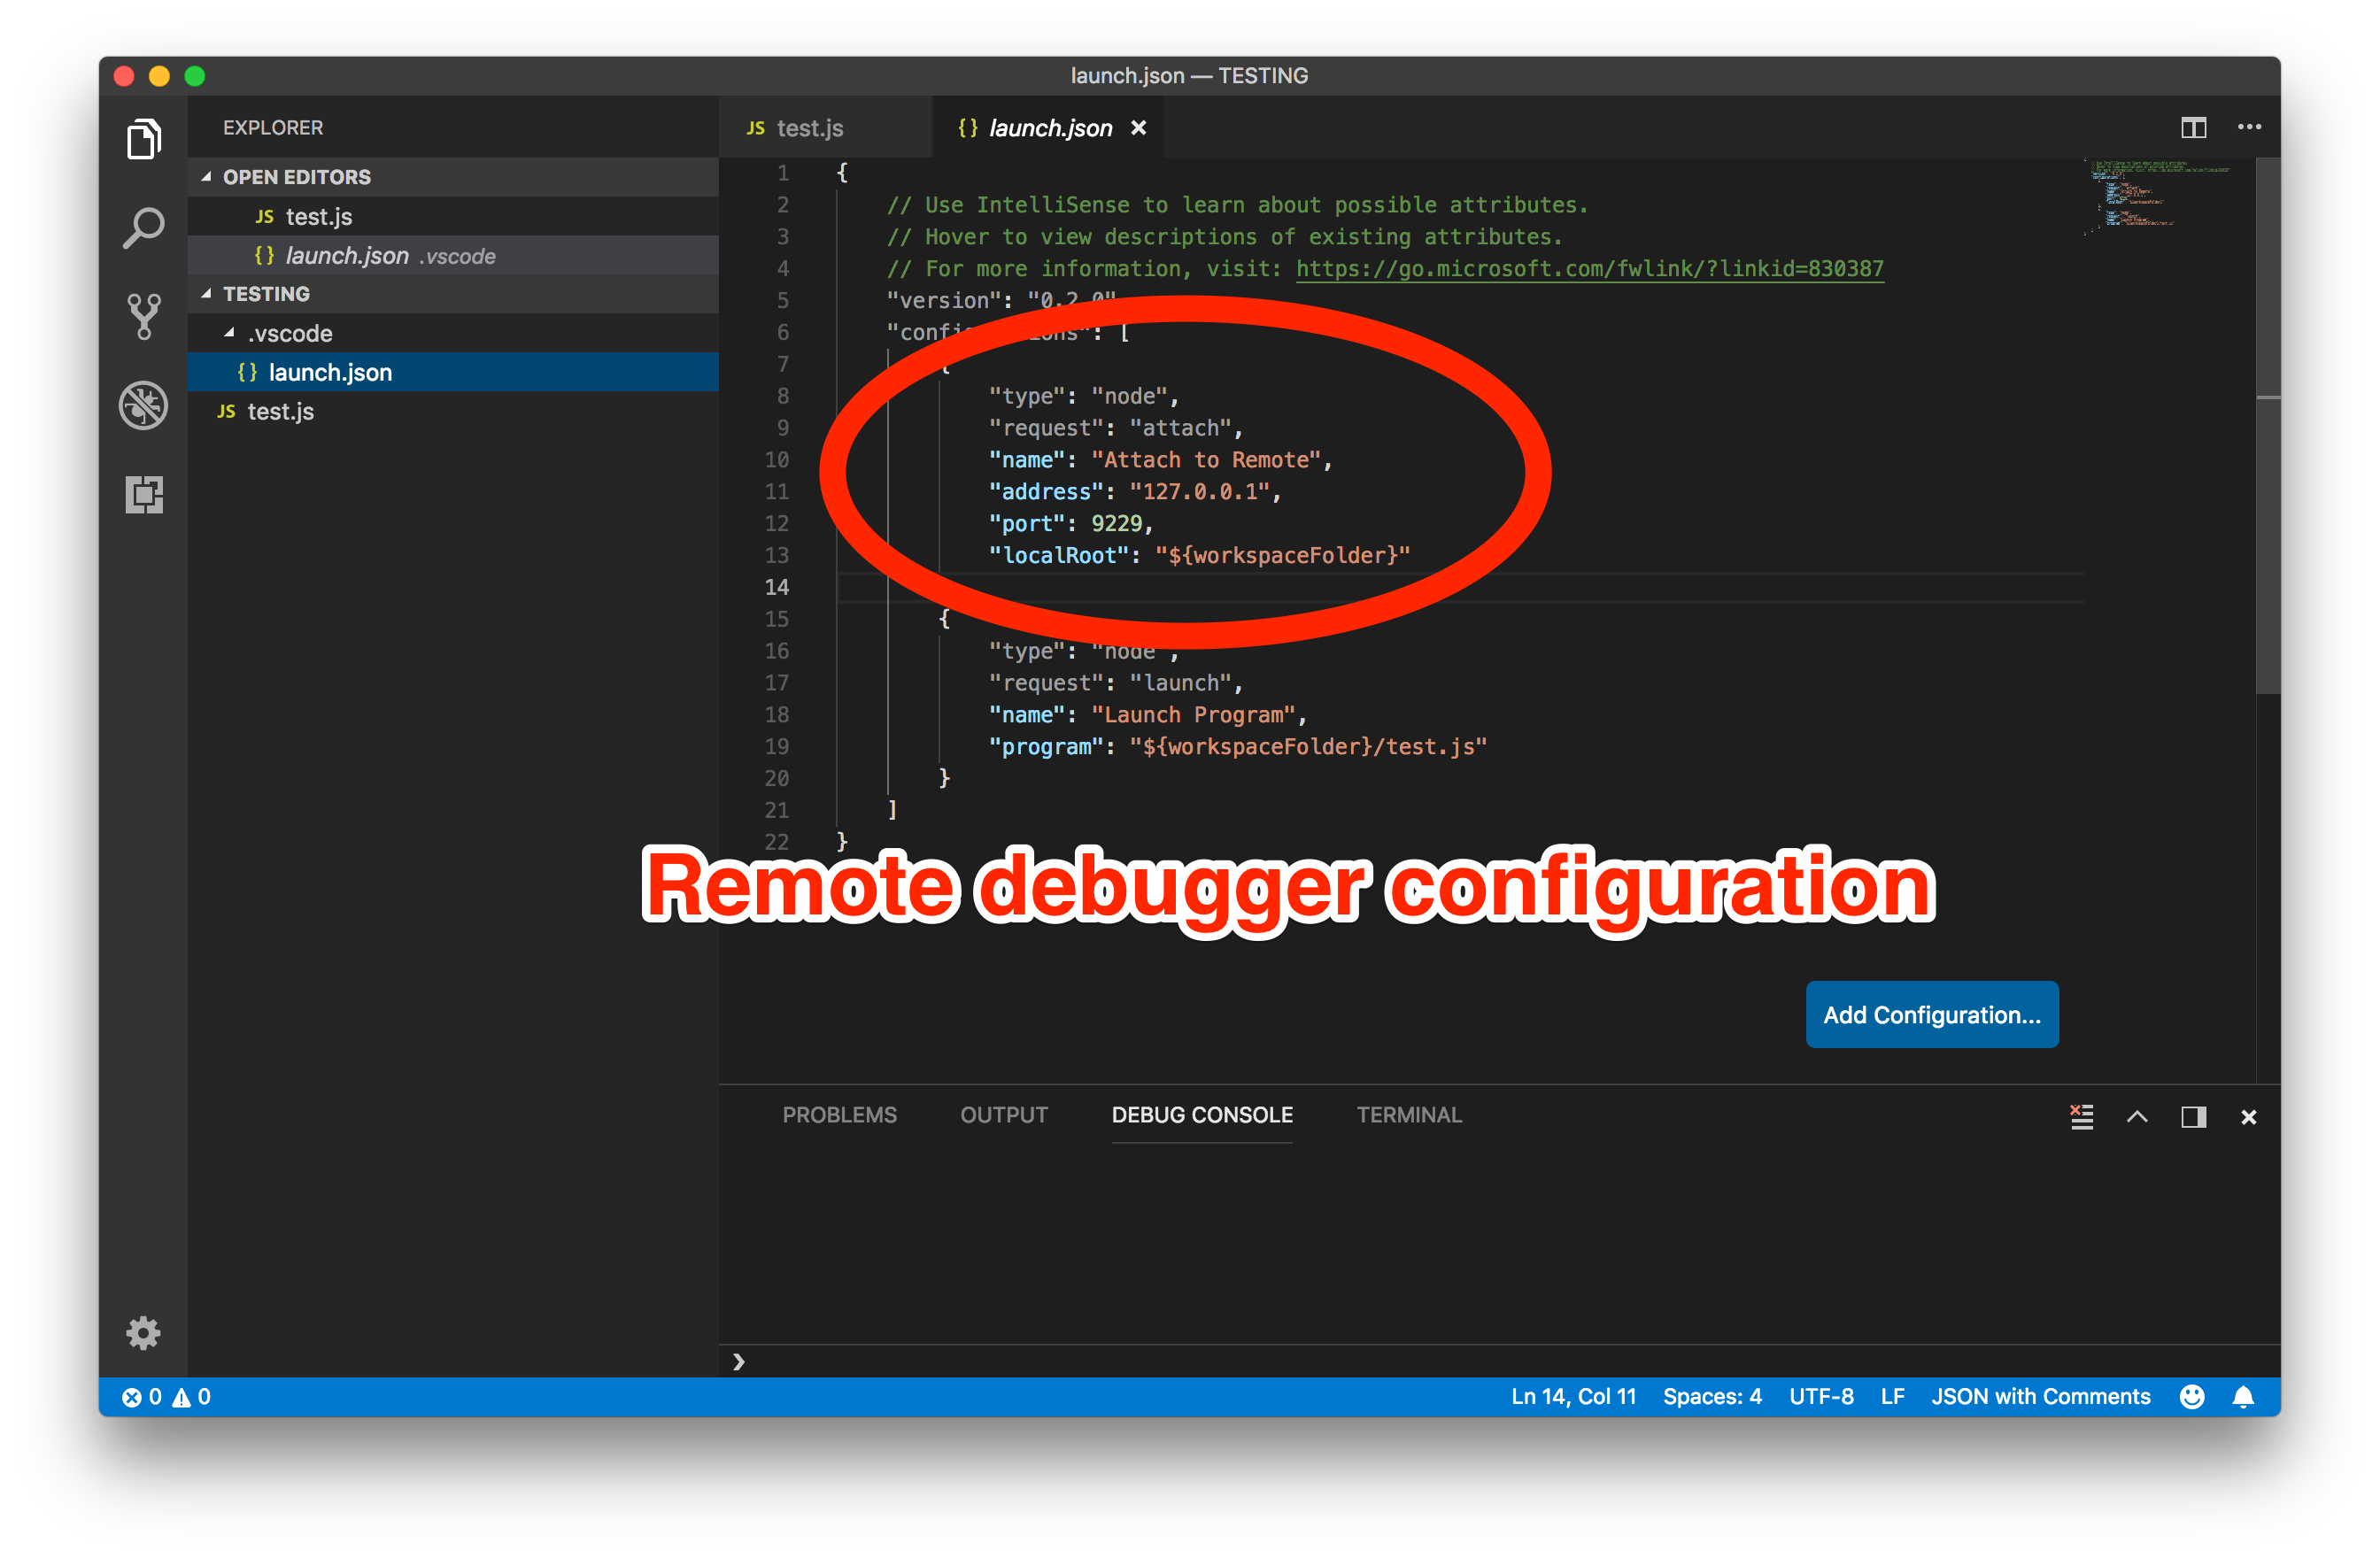
- Choose the new “attach to remote” debugging profile and click the Run button.
The “Loaded Scripts” window will show all the JavaScript files loaded by the Node.js process.
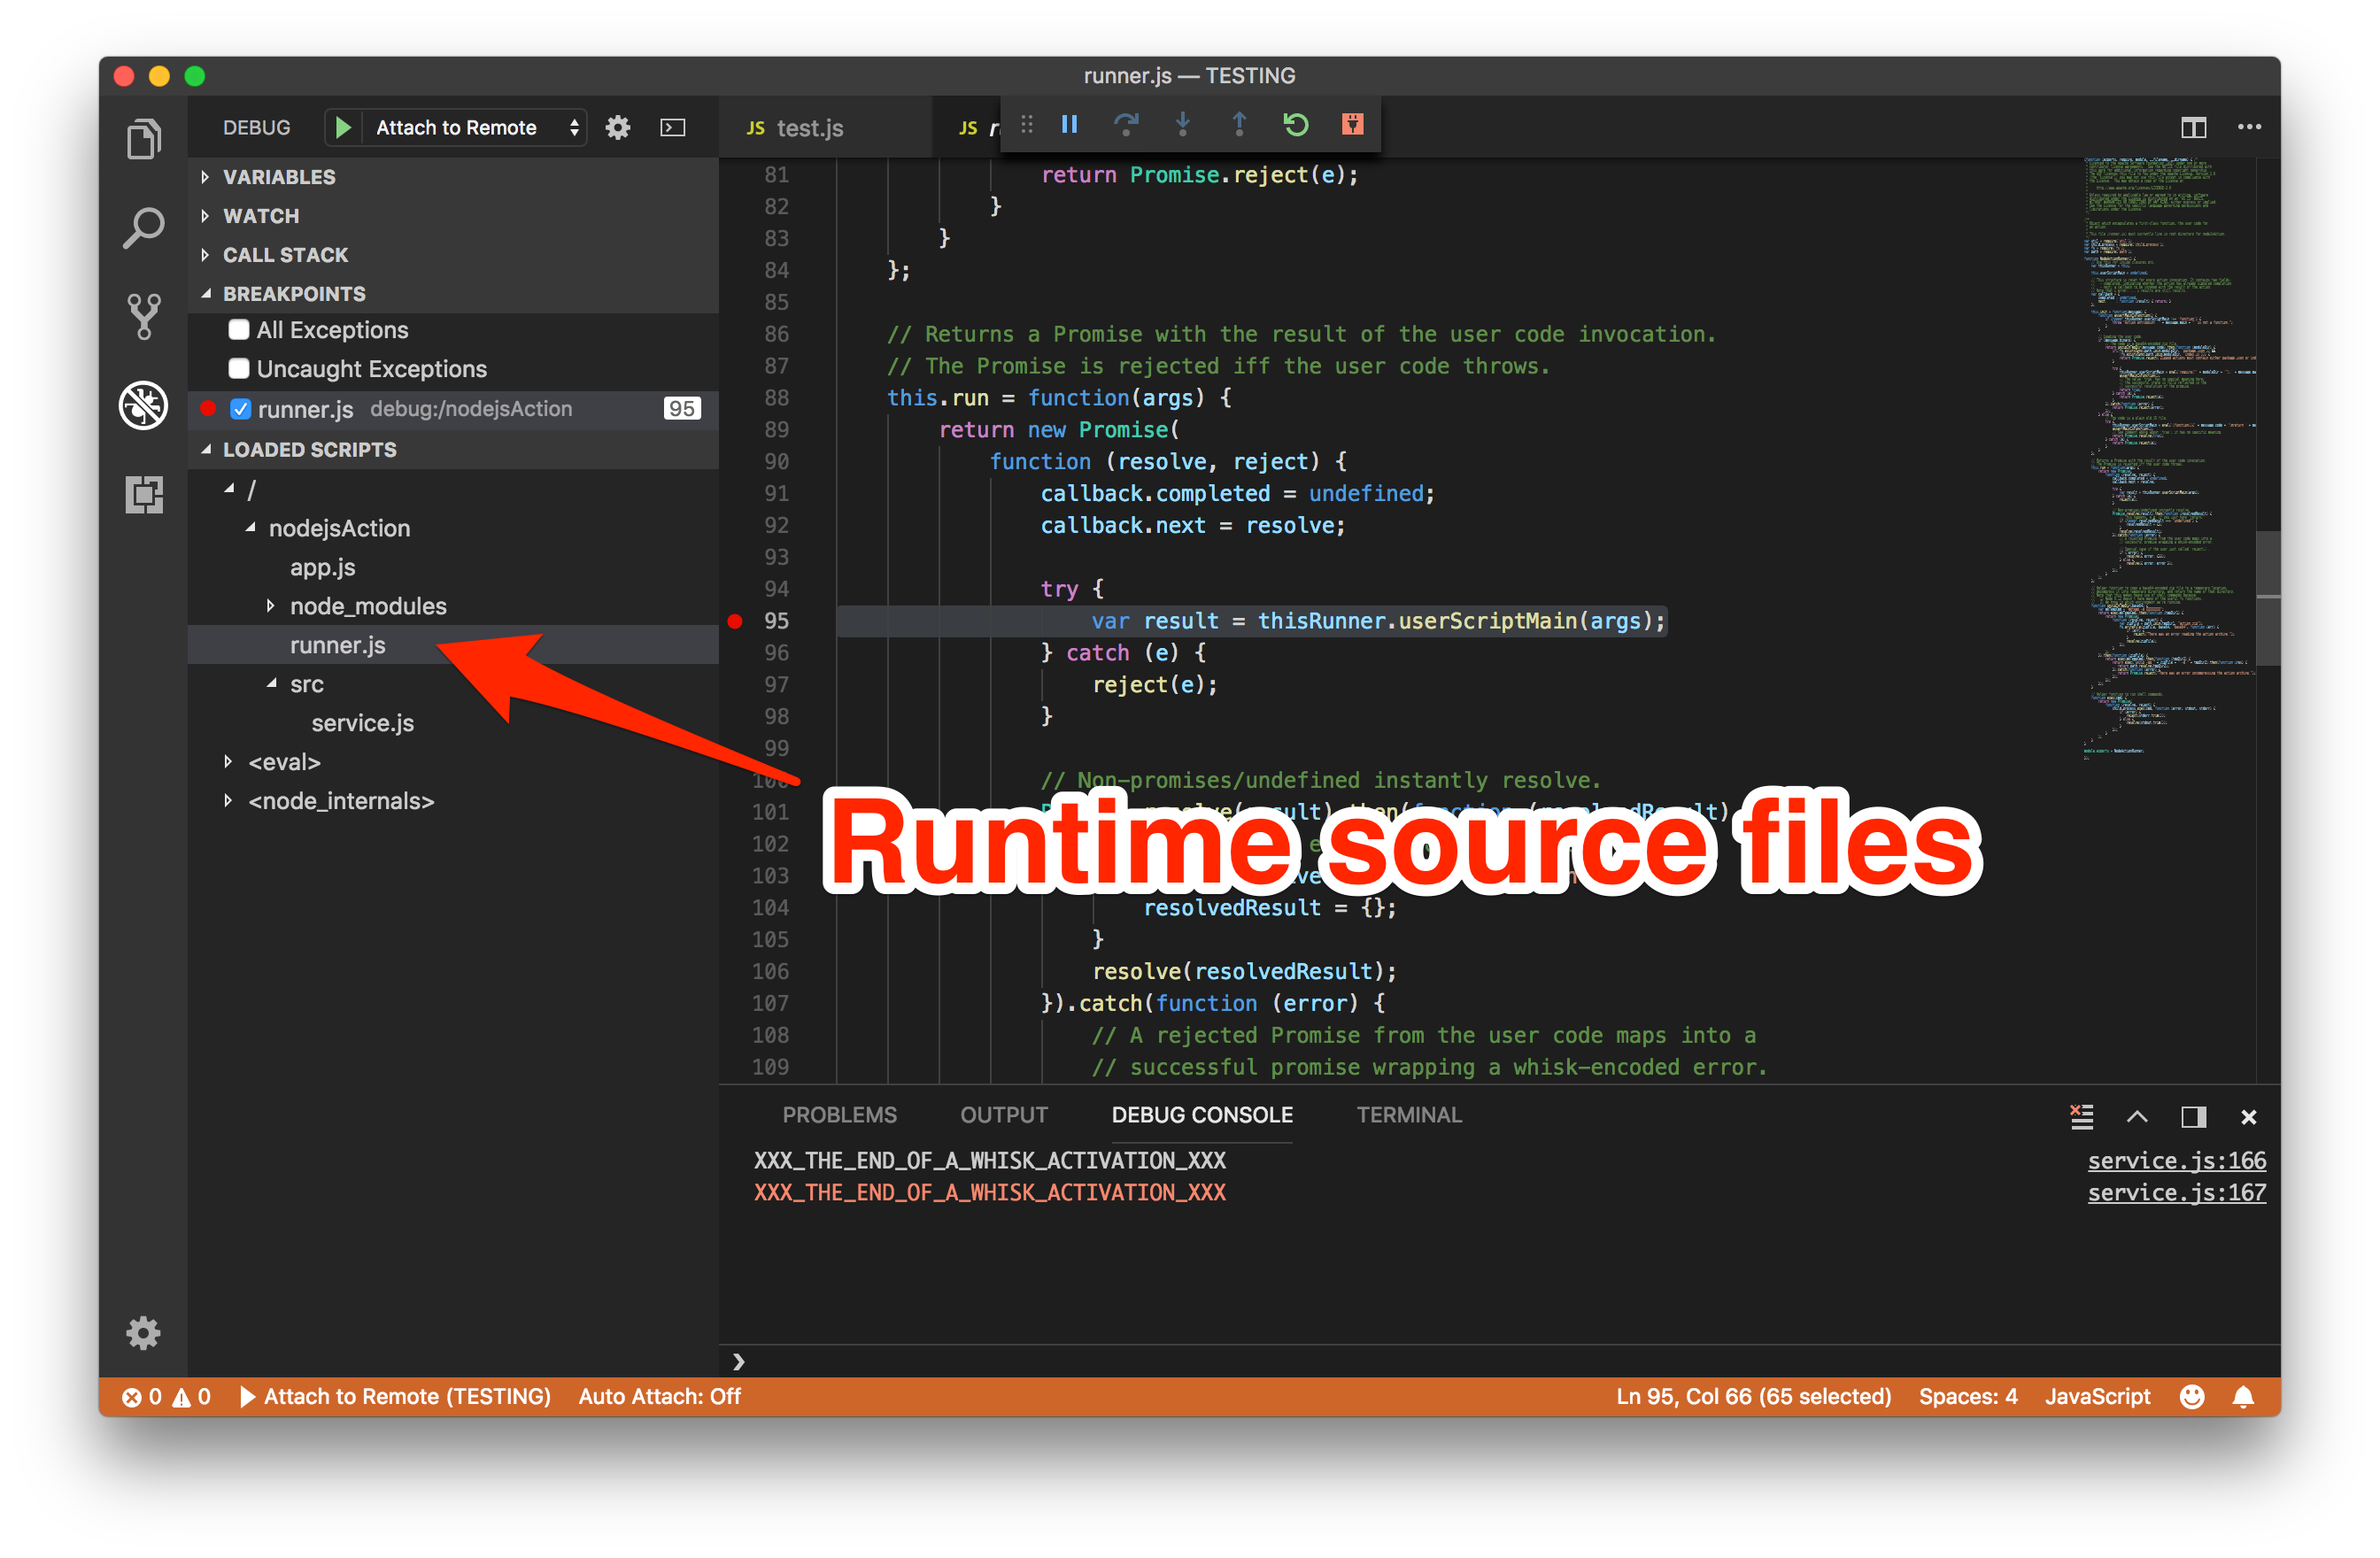
Setting breakpoints in the runner.js file will allow you to halt execution for debugging upon invocations.
Breakpoint Locations
Here are some useful locations to set breakpoints to catch errors in your serverless functions for the OpenWhisk Node.js runtime environments.
Initialisation Errors - Source Actions
If you are creating OpenWhisk actions from JavaScript source files, the code is dynamically evaluated during the /init request at this location. Putting a breakpoint here will allow you to catch errors thrown during that eval() call.
Initialisation Errors - Binary Actions
If you are creating OpenWhisk actions from a zip file containing JavaScript modules, this location is where the archive is extracted in the runtime filesystem. Putting a breakpoint here will catch errors from the extraction call and runtime checks for a valid JavaScript module.
This code is where the JavaScript module is imported once it has been extracted. Putting a breakpoint here will catch errors thrown importing the module into the Node.js environment.
Action Handler Errors
For both source file and zipped module actions, this location is where the action handler is invoked on each /run request. Putting a breakpoint here will catch errors thrown from within action handlers.
Invoking OpenWhisk Actions
Once you have attached the debugger to the remote Node.js process, you need to send the API requests to simulate the platform invocations. Runtime containers use separate HTTP endpoints to import the action source code into the runtime environment (/init) and then fire the invocation requests (/run).
Generating Init Request Body - Source Files
If you are creating OpenWhisk actions from JavaScript source files, send the following JSON body in the HTTP POST to the /init endpoint.
{
  "value": {
    "main": "<FUNCTION NAME IN SOURCE FILE>",
    "code": "<INSERT SOURCE HERE>"
  }
}
code is the JavaScript source to be evaluated which contains the action handler. main is the function name in the source file used for the action handler.
Using the jq command-line tool, we can create the JSON body for the source code in file.js.
$ cat file.js | jq -sR '{value: {main: "main", code: .}}'
Generating Init Request Body - Zipped Modules
If you are creating OpenWhisk actions from a zip file containing JavaScript modules, send the following JSON body in the HTTP POST to the /init endpoint.
{
  "value": {
    "main": "<FUNCTION NAME ON JS MODULE>",
    "code": "<INSERT BASE64 ENCODED STRING FROM ZIP FILE HERE>",
    "binary": true
  }
}
code must be a Base64 encoded string for the zip file. main is the function name returned in the imported JavaScript module to call as the action handler.
Using the jq command-line tool, we can create the JSON body for the zip file in action.zip.
$ base64 action.zip | tr -d '\n' | jq -sR '{value: {main: "main", binary: true, code: .}}'
Sending Init Request
The HTTPie tool makes it simple to send HTTP requests from the command-line.
Using this tool, the following command will initialise the runtime container with an OpenWhisk action.
$ http post localhost:8080/init < init.json
HTTP/1.1 200 OK
...
{
    "OK": true
}
If this HTTP request returns without an error, the action is ready to be invoked.
No further initialisation requests are needed unless you want to modify the action deployed.
Generating Run Request Body
Invocations of the action handler functions are triggered from a HTTP POST to the /run API endpoint.
Invocations parameters are sent in the JSON request body, using a JSON object with a value field.
{
  "value": {
    "some-param-name": "some-param-value",
    "another-param-name": "another-param-value",
  }
}
Sending Run Request
Using the HTTPie tool, the following command will invoke the OpenWhisk action.
$ http post localhost:8080/run < run.json
HTTP/1.1 200 OK
...
{
    "msg": "Hello world"
}
Returned values from the action handler are serialised as the JSON body in the HTTP response. Issuing further HTTP POST requests to the /run endpoint allows us to re-invoke the action.
Conclusion
Lack of debugging tools is one of the biggest complaints from developers migrating to serverless platforms.
Using an open-source serverless platform helps with this problem, by making it simple to run the same containers locally that are used for the platform’s runtime environments. Debugging tools can then be started from inside these local environments to simulate remote access.
In this example, this approach was used to enable the remote debugging service from the OpenWhisk Node.js runtime environment. The same approach could be used for any language and debugging tool needing local access to the runtime environment.
Having access to the Node.js debugger is huge improvement when debugging challenging issues, rather than just being reliant on logs and metrics collected by the platform.