
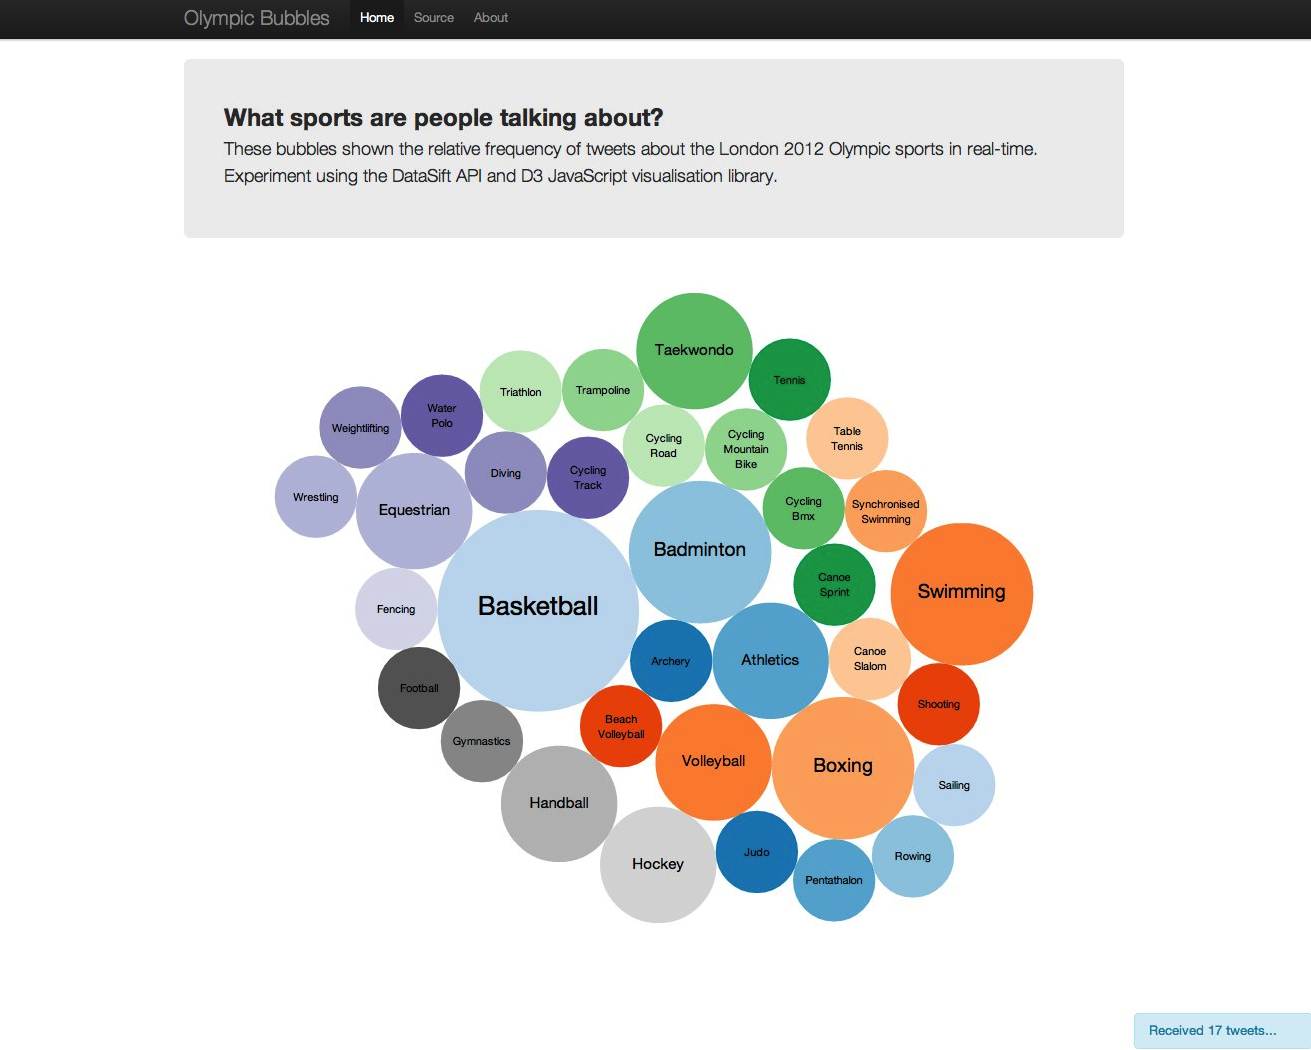
Introducing Olympic Bubbles, an experiment visualising mentions of the London 2012 Olympics sports on Twitter in real-time.
With the London 2012 Olympics having multiple events running concurrently, Twitter’s become invaluable for catching up on the day’s action, deciding what to watch and getting real-time insight into current events.
Having recently started to play with a JavaScript visualisation library (D3), this seemed like a great opportunity to connect the two activities and automate the analysis of Twitter to visualise the most talked about Olympic sports.
Before we can visualise the data, we needed a way to filter the Twitter firehose for tweets mentioning the Olympic games…
Analysing tweets for Olympic sports
Twitter provides a public API for filtering their stream, based on keyword matching, but there are two issues with this service:
- No access to the firehose. Results don’t represent the full set of matches from the Twitter “firehose”, only a sample are returned.
- Polling, not real-time. No support for receiving results in real-time, the client has to manually poll for new results over HTTP.
These problems made Twitter’s API unsuitable and an alternative was needed…
Enter DataSift.
DataSift is a real-time media curation platform, allowing you to mine the Twitter Firehose for tweets matching the specific criteria of your choice. DataSift’s custom Curation Stream Definition Language allows you to filter based on any meta data within a tweet
DataSift are one of only two companies with unrestricted access to the Twitter “firehose”. They provide a free trial account, with enough credit to mine 10,000 tweets.
Write a custom stream filter
DataSift provides a custom query language, CSDL (Curated Stream Definition Language), for defining stream filters that can match messages based upon text, location, users and much more.
Defining a new filter, we’re interested in all messages that contain references to the London 2012 Olympics along with a sport. Matching all tweets containing key words can be performed using the contains operator on the content property of the interaction instance. Each interaction represents a single tweet from the Twitter Firehose.
The example below shows how to match any tweets which mention the word olympic but ignore those without a valid sport, using the conjunction and contains_any operator to make sure those matched messages also contain one of the pre-defined keywords for the sports.
interaction.content contains "olympic"
AND
interaction.content contains_any "
    Archery,
    Athletics,
    Badminton,
    ...
    Volleyball,
    Water Polo,
    Weightlifting,
    Wrestling"
Looking over the CSDL documentation, there was a feature that allowed user generated tags to be appended to filtered messages. Rather than having the client-side code manually parse each message to determine which sports were referenced, we can append a tag during the filtering process, as shown below.
tag "archery" {
  interaction.content contains "archery"
}

tag "athletics" {
  interaction.content contains "athletics"
}

tag "badminton" {
  interaction.content contains "badminton"
}
Once the stream has been defined, making it public allows any user to access the stream results. You can see the full stream definition and view a preview of the results here.
Real-time results
Now we have a stream defined, we need to access the results in the browser in real-time. Along with a traditional REST API, DataSift also provides a streaming API using WebSockets. WebSockets provide a bi-directional channel for messages between a client and server, without having to poll for replies. Using their streaming endpoint, we receive messages from our filtered firehose in real-time.
Setting up the connection and monitoring for new messages was extremely simple, as shown below. Each time a new message arrives, we increment the frequency count for each of the pre-defined sports based on the interaction tag.
var ws = new WebSocket('ws://websocket.datasift.com/<hash>?username=<username>&api_key=<api_key>');

ws.onmessage = function(evt) {
    var msg = JSON.parse(evt.data),
        tags = stats.interaction.tags;

    tags.forEach(function (tag) {
        // now publish notification of new tagged messages...
    });
}
Visualising The Tweets
Now we have the data, how should we visualise the results?
There are hundreds of different charting libraries for JavaScript but rather than drawing a static histogram of the sport frequencies, we want to incorporate the real-time aspect into the visualisation. As new messages are received, the visualisation should grow and morph, tied to the transitional nature of the data.
D3 is a JavaScript visualisation library which provides just that capability.
D3.js is a JavaScript library for manipulating documents based on data, allowing you to bind arbitrary data to a Document Object Model (DOM), and then apply data-driven transformations to the document.
Developed by Mike Bostock of the Stanford Visualisation Group, the library has fantastic documentation along with an extensive examples gallery, which provides a great starting point for developers.
Creating Bubbles
Reviewing the gallery, the Bubble example seemed like a good starting point. Each bubble would represent a single sport and the size would be proportional to the frequency of tweets for that sport.
Given a list of sports and frequencies, how do we know where to render the nodes and what size they should be?
D3 provides a series of algorithms for converting data series into visual layouts, the Bubble example uses Pack. This layout turns a hierarchical data structure into “enclosure diagrams using containment (nesting) to represent the hierarchy”.
Running our data through this function, shown below, produces a series of position values (coordinate location pairs with radius) to construct our bubbles from.
var sports = {
    archery: 1,
    athletics: 2,
    badminton: 3
    ...
};

var layout = d3.layout.pack().sort(null).size([this.width, this.height]);
    positions = layout.nodes({children: d3.entries(sports)}
Using the position information, we need to bind these values to appropriate DOM elements. Following the example code, we’re going to render an SVG Group node to contain the Circle element with a Text node (displaying the sport’s label). The example below shows the code needed for this.
var vis = d3.select(this.node).append("svg")
            .attr("width", width)
            .attr("height", height);

var chart = vis.selectAll("g.node")
               .data(this.layout.nodes(data))
               .enter().append("g")
               .attr("transform", function (d) { return "translate(" + d.x + "," + d.y + ")"; });

// Append circle with radius from layout and fill with arbitary colour
chart.append("circle")
     .attr("r", function (d) { return d.r; })
     .style("fill", function (d) { return fill(d.key) });

// Add text label to bubble.
chart.append("text")
     .attr("text-anchor", "middle")
     .attr("dy", ".3em");
Choosing an arbitrary colour for the bubble uses the d3.scale.category20c method, referenced here by fill(), to produce a mapping between our category labels and a series of twenty colours.
The example above is a slightly condensed version of the actual code, ignoring the handling of multi-lined labels and that font-sizes are relative to the bubble size, due to brevity.
Animating Bubbles
What happens when our data changes?
As we receive more messages, the relative frequencies of the sports will change and the bubble layout will need updating. Using D3, we want to visually transition the bubbles to their new positions, watching them grow and shrink in real-time.
Re-calculating the layout simply needs us to re-run the pack algorithm with the updated values, binding the new data to the existing chart.
chart.data(layout.nodes({children: d3.entries(sports)}));
Now, we just need to use the transition method to translate the old properties to the new values, over a three second period. As we move the parent group node for each bubble, we need also update the bubble radius and label font size to make them proportional to the parent.
// Move bubble node to new position
var trans = this.chart
    .transition()
    .duration(3000)
    .attr("transform", function(d) { return "translate(" + d.x + "," + d.y + ")"; })
    .attr("r", function(d) { return d.r; });

// ... update circle radius
trans.select("circle")
     .transition()
     .attr("r", function(d) { return d.r; });

// ... update text size
trans.select("text")
     .transition()
     .attr("font-size", function (d) { return ((d.r / 50)) + "em"; });
…and that’s it!
Each time new messages flow in from the backend, the data values change, which triggers a new transition. With a real-time stream of new messages constantly arriving, the visualisation is constantly morphing and changing.
Live Demo
If you want to see this demo in action, there’s a hosted version at http://datasift.jamesthom.as. You’ll need to sign up for a free DataSift account here and use your authentication credentials to allow us to access the Twitter firehose.
Source code for the demo is available on Github here.
Finally…
Why Olympic Bubbles?
It’s a terrible name but as the quote goes…
“There are only two hard things in Computer Science: cache invalidation and naming things”.
…and writing this demo was easier than coming up with a sensible name!