
Logs are boring.
It used to be the only time you’d be looking at your application logs was when something went wrong.
Logs filled up disk space until they rotated out of existence.
…but now businesses are increasingly focused on using data to drive decisions.
Which advert leads to the highest click-through rates?
How did that last website change affect user retention?
What customer devices should our website support?
Guess where the answers lie?
Logs.
Storing, processing and querying logs effectively is helping businesses succeed.
Introducing the ELK (Elasticsearch, Logstash, Kibana) stack…

Five years ago, Elasticsearch, an open-source full-text search engine, was released. It’s now the second most popular enterprise search engine. Complementing this project were Logstash and Kibana. Logstash was a log processing pipeline that could normalize streaming logs into a centralised Elasticsearch cluster. Kibana was an analytics and visualisation platform for turning those logs into actionable insights.
These tools were commonly used together, now known as the ELK stack, to deliver…
“an end-to-end stack that delivers actionable insights in real time from almost any type of structured and unstructured data source.”
ELK, making logs awesome!
Manually installing and configuring Elasticsearch, Logstash and Kibana is not a trivial task.
Luckily, there is a better way…
Docker
{%img https://upload.wikimedia.org/wikipedia/commons/7/79/Docker_(container_engine)_logo.png %}
_logo.png)
“Docker allows you to pack, ship and run any application as a lightweight container”.
Docker images define pre-configured environments that containers are started from. Docker Hub is the public image registry, where anyone can publish, search and retrieve new images.
{%img /images/Docker%20Hub.png %}
Rather than having to install and configure individual software packages, we can pull down one of the many existing Docker images for the ELK stack.
With one command, we can spin up an entire ELK instance on any platform with no extra configuration needed.
Magic.
IBM Containers
IBM recently announced Docker support for their Platform-as-a-Service cloud service, IBM Bluemix. Developers can now deploy and manage Docker containers on a scalable cloud platform.
IBM Containers provides the following services:
- Private image registry
- Elastic scaling and auto-recovery
- Persistent storage and advanced networking configuration
- Automated security scans
- Integration with the IBM Bluemix cloud services.
Using this service, we can build and test a custom ELK container in our local development environment and “web-scale” it by pushing to the IBM Bluemix cloud platform.
Manging Application Logs
Once our ELK instance is running, we can then start to push application logs from other applications running on IBM Bluemix into the service. We’ll look at automatically setting up a log drain to forward all applications logs into a centralised Elasticsearch service. We can then start to drive business decisions using data rather than intuition using Kibana, the visualisation dashboard.
This blog post will explain the technical details of using Docker to create a customised ELK service that can be hosted on a scalable cloud platform.
Running ELK instances Using Docker
Docker Hub has over forty five thousands public images available. There are multiple public images we can pull down with a pre-configured ELK stack. Looking at the options, we’re going to use the sebp/elk repository because it’s popular and easily modifiable with a custom configuration.
We’re going to start by pulling the image into our local machine and running a container to check it’s working…
$ docker pull sebp/elk
$ docker run -p 5601:5601 -p 9200:9200 -p 5000:5000 -it --name elk sebp/elk
That last command will start a new container from the sebp/elk image, exposing the ports for Kibana (5601), Elasticsearch (9200) and Logstash (5000) for external access. The container has been started with the -i flag, interactive mode, allowing us to monitor the container logs in the console. When the instance has started, we can view the status output from command line.
$ docker ps
CONTAINER ID        IMAGE               COMMAND                CREATED             STATUS              PORTS                                                                              NAMES
42d40d1fb59c        sebp/elk:latest     "/usr/local/bin/star   27 seconds ago      Up 26 seconds       0.0.0.0:5000->5000/tcp, 0.0.0.0:5601->5601/tcp, 0.0.0.0:9200->9200/tcp, 9300/tcp   elk
Using Mac OS X for local development, we’re using the Boot2Docker project to host a Linux VM for deploying Docker containers locally. With the following command, we can discover the virtual IP address for the ELK container.
$ boot2docker ip
192.168.59.103
Opening a web browser, we can now visit http://192.168.59.103:5601 to show the Kibana application. For now, this isn’t very useful because Elasticsearch has no logs!
Let’s fix that…
Draining Logs from Cloud Foundry
Cloud Foundry, the open-source project powering IBM Bluemix, supports setting up a syslog drain to forward all applications logs to a third-party logging service. Full details on configuring this will be shown later.
Scott Frederick has already written an amazing blog post about configuring Logstash to support the log format used by the Cloud Foundry. Logstash expects the older RFC3164 syslog formatting by default, whilst Cloud Foundry emits log lines that follow the newer RFC5424 standard.
Scott provides the following configuration file that sets up the syslog input channels, running on port 5000, along with a custom filter that converts the incoming RFC5424 logs into an acceptable format.
input {
  tcp {
    port => 5000
    type => syslog
  }
  udp {
    port => 5000
    type => syslog
  }
}

filter {
  if [type] == "syslog" {
    grok {
      match => { "message" => "%{SYSLOG5424PRI}%{NONNEGINT:syslog5424_ver} +(?:%{TIMESTAMP_ISO8601:syslog5424_ts}|-) +(?:%{HOSTNAME:syslog5424_host}|-) +(?:%{NOTSPACE:syslog5424_app}|-) +(?:%{NOTSPACE:syslog5424_proc}|-) +(?:%{WORD:syslog5424_msgid}|-) +(?:%{SYSLOG5424SD:syslog5424_sd}|-|) +%{GREEDYDATA:syslog5424_msg}" }
    }
    syslog_pri { }
    date {
      match => [ "syslog_timestamp", "MMM  d HH:mm:ss", "MMM dd HH:mm:ss" ]
    }
    if !("_grokparsefailure" in [tags]) {
      mutate {
        replace => [ "@source_host", "%{syslog_hostname}" ]
        replace => [ "@message", "%{syslog_message}" ]
      }
    }
    mutate {
      remove_field => [ "syslog_hostname", "syslog_message", "syslog_timestamp" ]
    }
  }
}

output {
  elasticsearch { }
}
Using this configuration, Logstash will accept and index our application logs into Elasticsearch.
Note: There is also a custom plugin to enable RFC5424 support.
Building Custom Docker Images
Using the custom Logstash configuration relies on building a new Docker image with this configuration baked in. We could download the Git repository containing the image source files, modify those and rebuild from scratch. However, an easier way uses the existing image as a base, applies our modifications on top and then generates a brand new image.
So, how do we build our own Docker images? Using a Dockerfile.
A Dockerfile is a text document that contains all the commands you would normally execute manually in order to build a Docker image.
Reviewing the Dockerfile for the sebp/elk image, configuration for logstash is stored in the /etc/logstash/conf.d/ directory. All we need to do is replace these files with our custom configuration.
Creating the custom configuration locally, we define a Dockerfile with instructions for building our image.
$ ls
01-syslog-input.conf 10-syslog.conf       Dockerfile
$ cat Dockerfile
FROM sebp/elk
RUN rm /etc/logstash/conf.d/01-lumberjack-input.conf
ADD ./01-syslog-input.conf /etc/logstash/conf.d/01-syslog-input.conf
ADD ./10-syslog.conf /etc/logstash/conf.d/10-syslog.conf
The Dockerfile starts with the “sebp/elk” image as a base layer. Using the RUN command, we execute a command to remove existing input configuration. After this the ADD command copies files from our local directory into the image.
We can now run the Docker build system to generate our new image.
$ docker build -t jthomas/elk .
Sending build context to Docker daemon 4.608 kB
Sending build context to Docker daemon
Step 0 : FROM sebp/elk
 ---> 2b71e915297f
Step 1 : RUN rm /etc/logstash/conf.d/01-lumberjack-input.conf
 ---> Using cache
 ---> f196b6833121
Step 2 : ADD ./01-syslog-input.conf /etc/logstash/conf.d/01-syslog-input.conf
 ---> Using cache
 ---> 522ba2c76b00
Step 3 : ADD ./10-syslog.conf /etc/logstash/conf.d/10-syslog.conf
 ---> Using cache
 ---> 79256ffaac3b
Successfully built 79256ffaac3b
$ docker images jthomas/elk
REPOSITORY          TAG                 IMAGE ID            CREATED             VIRTUAL SIZE
jthomas/elk         latest              79256ffaac3b        26 hours ago        1.027 GB
…and that’s it! We have a customised Docker image with our configuration changes ready for running.
Testing Our Custom Image
Before pushing this image to the cloud, we need to check it’s working correctly. Let’s start by starting a new container from our custom image locally.
$ docker run -p 5601:5601 -p 9200:9200 -p 5000:5000 -it --name elk jthomas/elk
Now, use the CF CLI to access recent logs for a sample application and paste the output into a telnet connection to port 5000 on our container.
$ cf logs APP_NAME --recent
Connected, dumping recent logs for app debug-testing in org james.thomas@uk.ibm.com / space dev as james.thomas@uk.ibm.com...

2015-07-02T17:14:47.58+0100 [RTR/1]      OUT nodered-app.mybluemix.net - [02/07/2015:16:14:47 +0000] "GET / HTTP/1.1" 200 0 7720 "-" "Java/1.7.0" 75.126.70.42:56147 x_forwarded_for:"-" vcap_request_id:1280fe18-e53a-4bd4-40a9-2aaf7c53cc54 response_time:0.003247100 app_id:f18c2dea-7649-4567-9532-473797b0818d
2015-07-02T17:15:44.56+0100 [RTR/2]      OUT nodered-app.mybluemix.net - [02/07/2015:16:15:44 +0000] "GET / HTTP/1.1" 200 0 7720 "-" "Java/1.7.0" 75.126.70.43:38807 x_forwarded_for:"-" vcap_request_id:4dd96d84-c61d-45ec-772a-289ab2f37c67 response_time:0.003848360 app_id:f18c2dea-7649-4567-9532-473797b0818d
2015-07-02T17:16:29.61+0100 [RTR/2]      OUT nodered-app.mybluemix.net - [02/07/2015:16:14:29 +0000] "GET /red/comms HTTP/1.1" 101 0 0 "-" "Mozilla/5.0 (Macintosh; Intel Mac OS X 10_10_3) AppleWebKit/537.36 (KHTML, like Gecko) Chrome/43.0.2357.130 Safari/537.36" 75.126.70.42:54826 x_forwarded_for:"75.126.70.42" vcap_request_id:15c2d4f8-e6ba-4a20-77b7-345aafd32e95 response_time:MissingFinishedAt app_id:f18c2dea-7649-4567-9532-473797b0818d
$ telnet 192.168.59.103 5000
Trying 192.168.59.103...
Connected to 192.168.59.103.
Escape character is '^]'.
// PASTE LOG LINES....
Starting a web browser and opening the Kibana page, port 5601, the log lines are now available in the dashboard. Success!
Pushing Docker Images To The Cloud
Having successfully built and tested our custom Docker image locally, we want to push this image to our cloud platform to allow us to start new containers based on this image.
Docker supports pushing local images to the public registry using the docker push command. We can choose to use a private registry by creating a new image tag which prefixes the repository location in the name.
IBM Containers’ private registry is available at the following address, registry.ng.bluemix.net.
Let’s push our custom image to the IBM Containers private registry…
$ docker tag jthomas/elk registry.ng.bluemix.net/jthomas/elk
$ docker images
REPOSITORY                                     TAG                 IMAGE ID            CREATED             VIRTUAL SIZE
jthomas/elk                                   latest              79256ffaac3b        43 hours ago        1.027 GB
registry.ng.bluemix.net/jthomas/elk           latest              79256ffaac3b        43 hours ago        1.027 GB
$ docker push registry.ng.bluemix.net/jthomas/elk
The push refers to a repository [registry.ng.bluemix.net/jthomas/elk] (len: 1)
Sending image list
Pushing repository registry.ng.bluemix.net/jthomas/elk (1 tags)
511136ea3c5a Image successfully pushed
...
79256ffaac3b: Image successfully pushed
Pushing tag for rev [79256ffaac3b] on {https://registry.ng.bluemix.net/v1/repositories/jthomas/elk/tags/latest}
Pushing custom images from a local environment can be a slow process. For the elk image, this means transferring over one gigabyte of data to the external registry.
We can speed this up by using IBM Containers to create our image from the Dockerfile, rather than uploading the built image.
Doing this from the command line requires the use of the IBM Containers command-line application.
Managing IBM Containers
IBM Containers enables you to manage your containers from the command-line with two options…
- IBM Containers Plug-in for the Cloud Foundry CLI.
- IBM Containers Extension, standalone command-line application.
Both approaches handle the interactions between the local and remote Docker hosts, while providing extra functionality not supported natively by Docker.
Full details on the differences and installation procedures for the two applications are available here.
Building Images Using IBM Containers
Building our image using the IBM Containers service uses the same syntax as Docker build. Local files from the current directory will be sent with the Dockerfile to the remote service. Once the image has been built, we can verify it’s available in the remote repository.
$ ice build -t registry.ng.bluemix.net/jthomas/elk .
zipped tar size: 706
Posting 706 bytes... It may take a while...
Step 0 : FROM sebp/elk
 ---> 2b71e915297f
Step 1 : RUN rm /etc/logstash/conf.d/01-lumberjack-input.conf
 ---> Using cache
 ---> ed13d91e0197
Step 2 : ADD ./01-syslog-input.conf /etc/logstash/conf.d/01-syslog-input.conf
 ---> Using cache
 ---> 808a4c7410c7
Step 3 : ADD ./10-syslog.conf /etc/logstash/conf.d/10-syslog.conf
 ---> Using cache
 ---> 117e4454b015
Successfully built 117e4454b015
The push refers to a repository [registry.ng.bluemix.net/jthomas/elk] (len: 1)
Sending image list
Pushing repository registry.ng.bluemix.net/jthomas/elk (1 tags)
Image 117e4454b015 already pushed, skipping
Pushing tag for rev [117e4454b015] on {https://registry.ng.bluemix.net/v1/repositories/jthomas/elk/tags/latest}
$ ice images
REPOSITORY                                TAG                 IMAGE ID            CREATED             VIRTUAL SIZE
registry.ng.bluemix.net/jthomas/elk       latest              5454d3ec-0f3        44 hours ago        0 B
registry.ng.bluemix.net/ibmliberty        latest              3724d2e0-06d        9 days ago          0 B
registry.ng.bluemix.net/ibmnode           latest              9435349e-8b4        9 days ago          0 B
All private repositories on IBM Bluemix have two official images for supported versions of NodeJS and Websphere Liberty.
We can now see the third image is the custom ELK stack that was built.
Starting ELK Containers
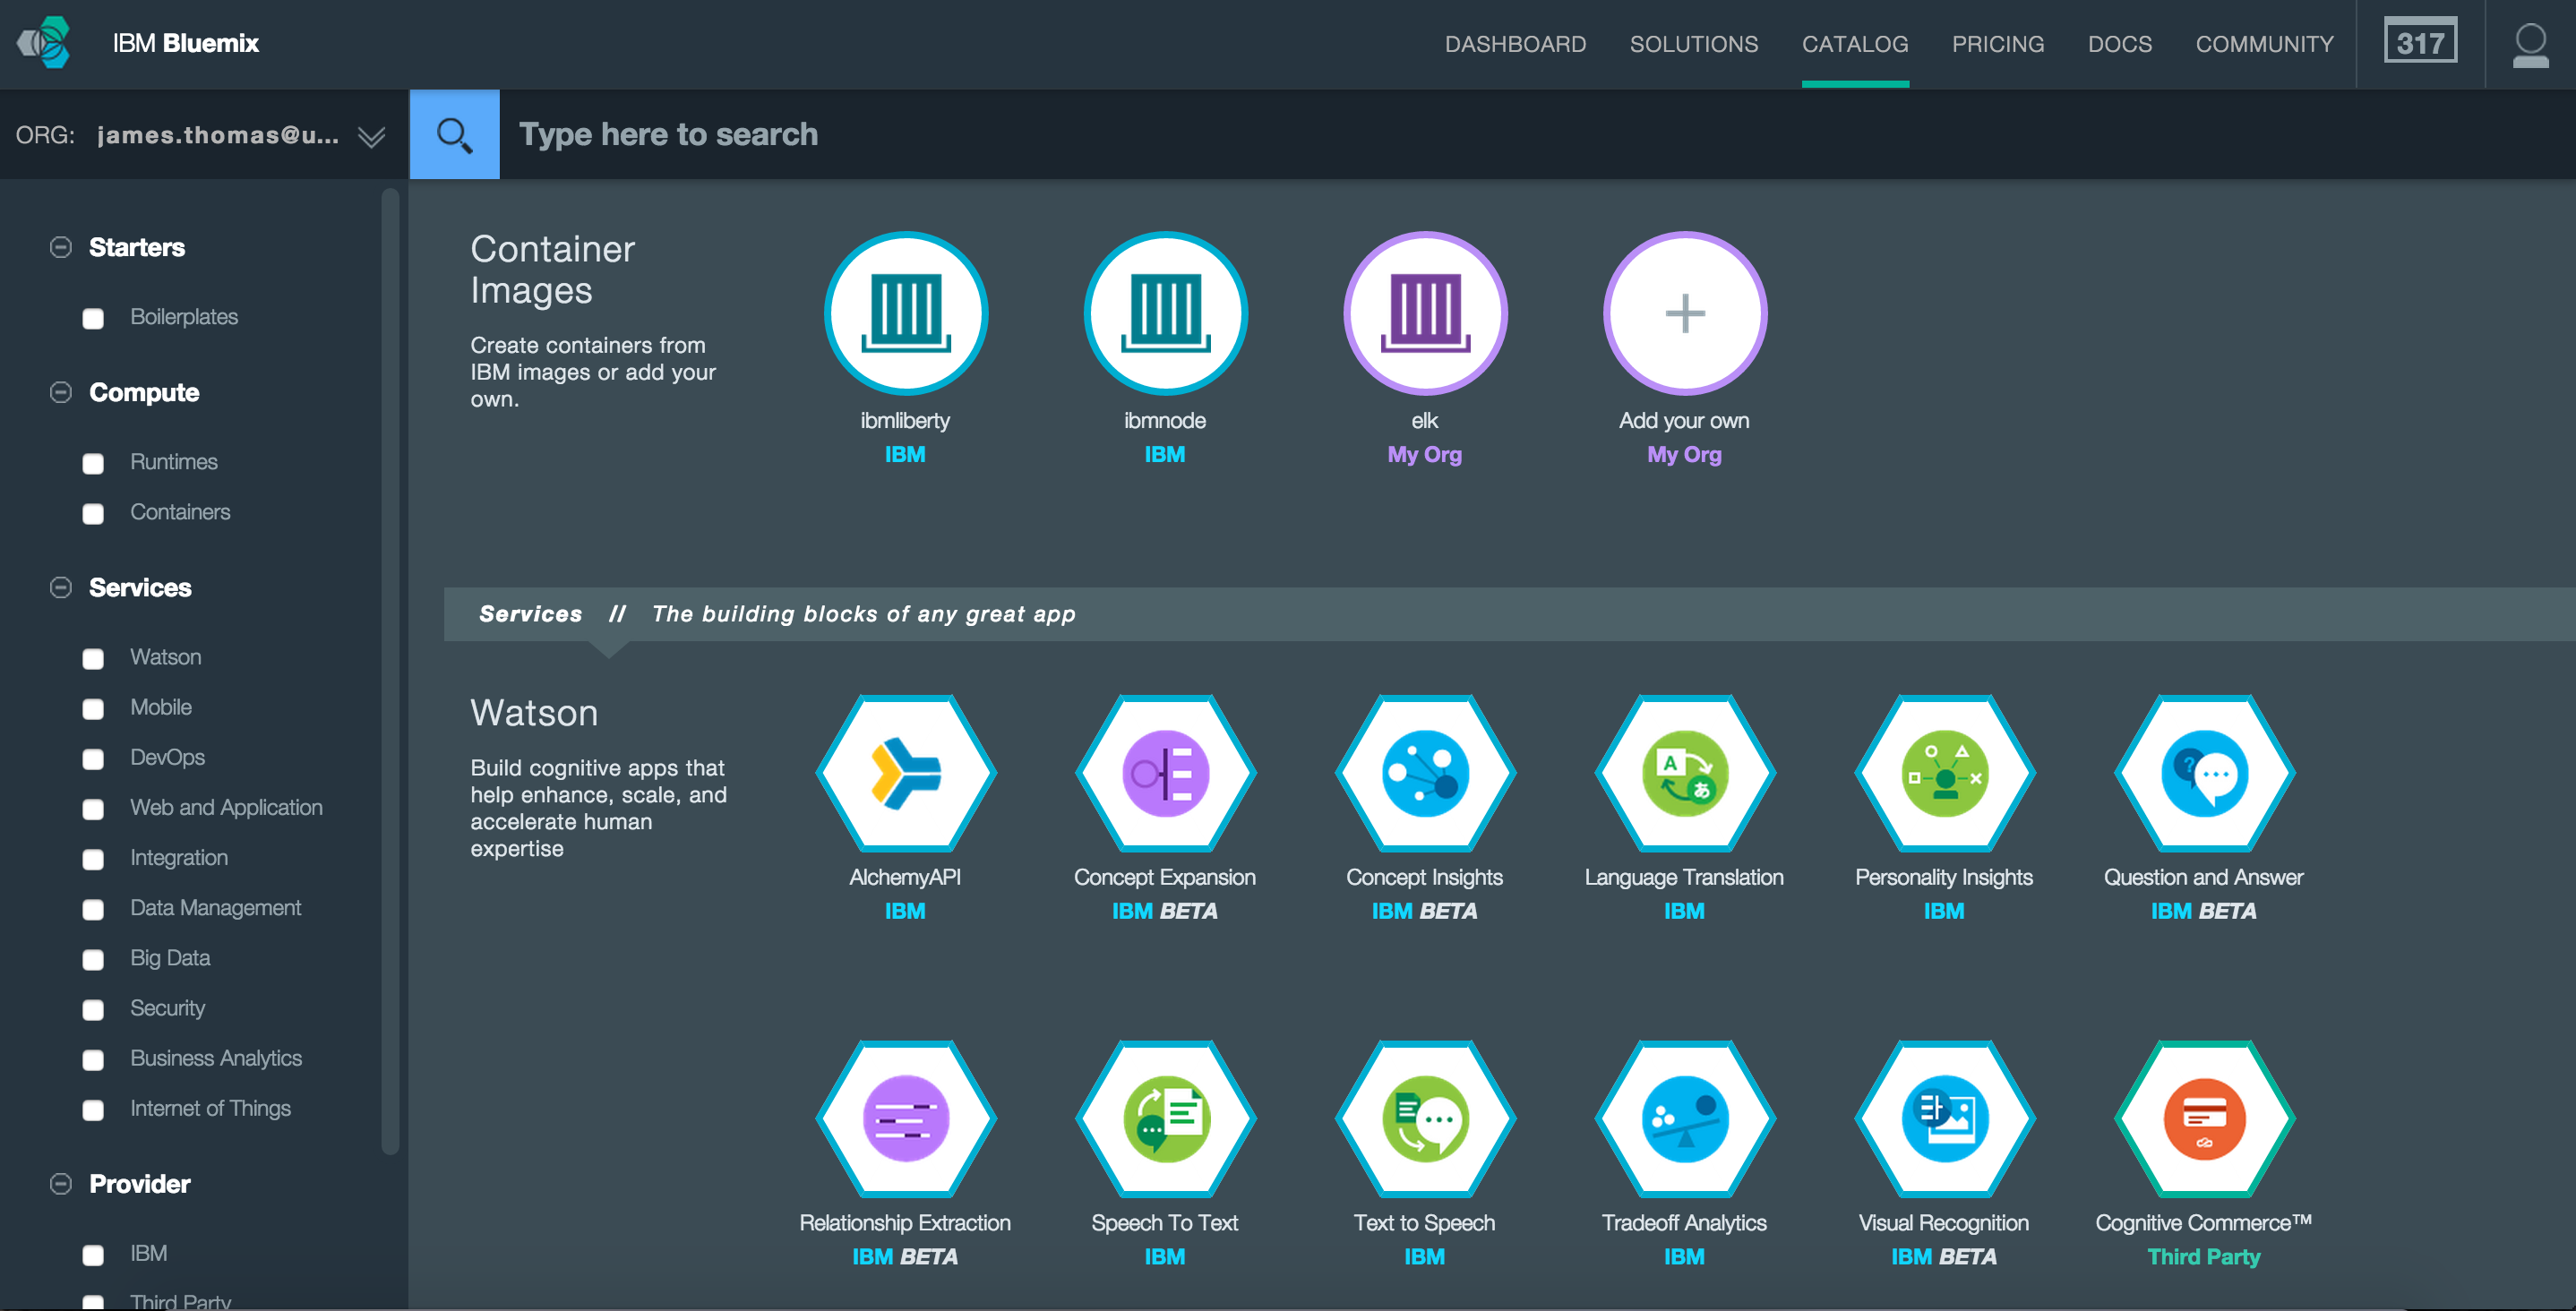
Starting containers from images in the IBM Containers registry can be done using the command-line applications or through the IBM Bluemix UI. In this example, we’ll be using the IBM Bluemix UI to start and configure a new ELK container from our pre-configured image.
Logging into the IBM Bluemix, the Catalogue page shows the list of available images used to create new containers. We have both the official images from IBM Containers and our custom ELK service.
Selecting the ELK image, we can configure and run a new container from this image. Setting up a new container with a public IP address, memory limit to 1GB and expose the same ports as running locally (5000, 5601 and 9200).
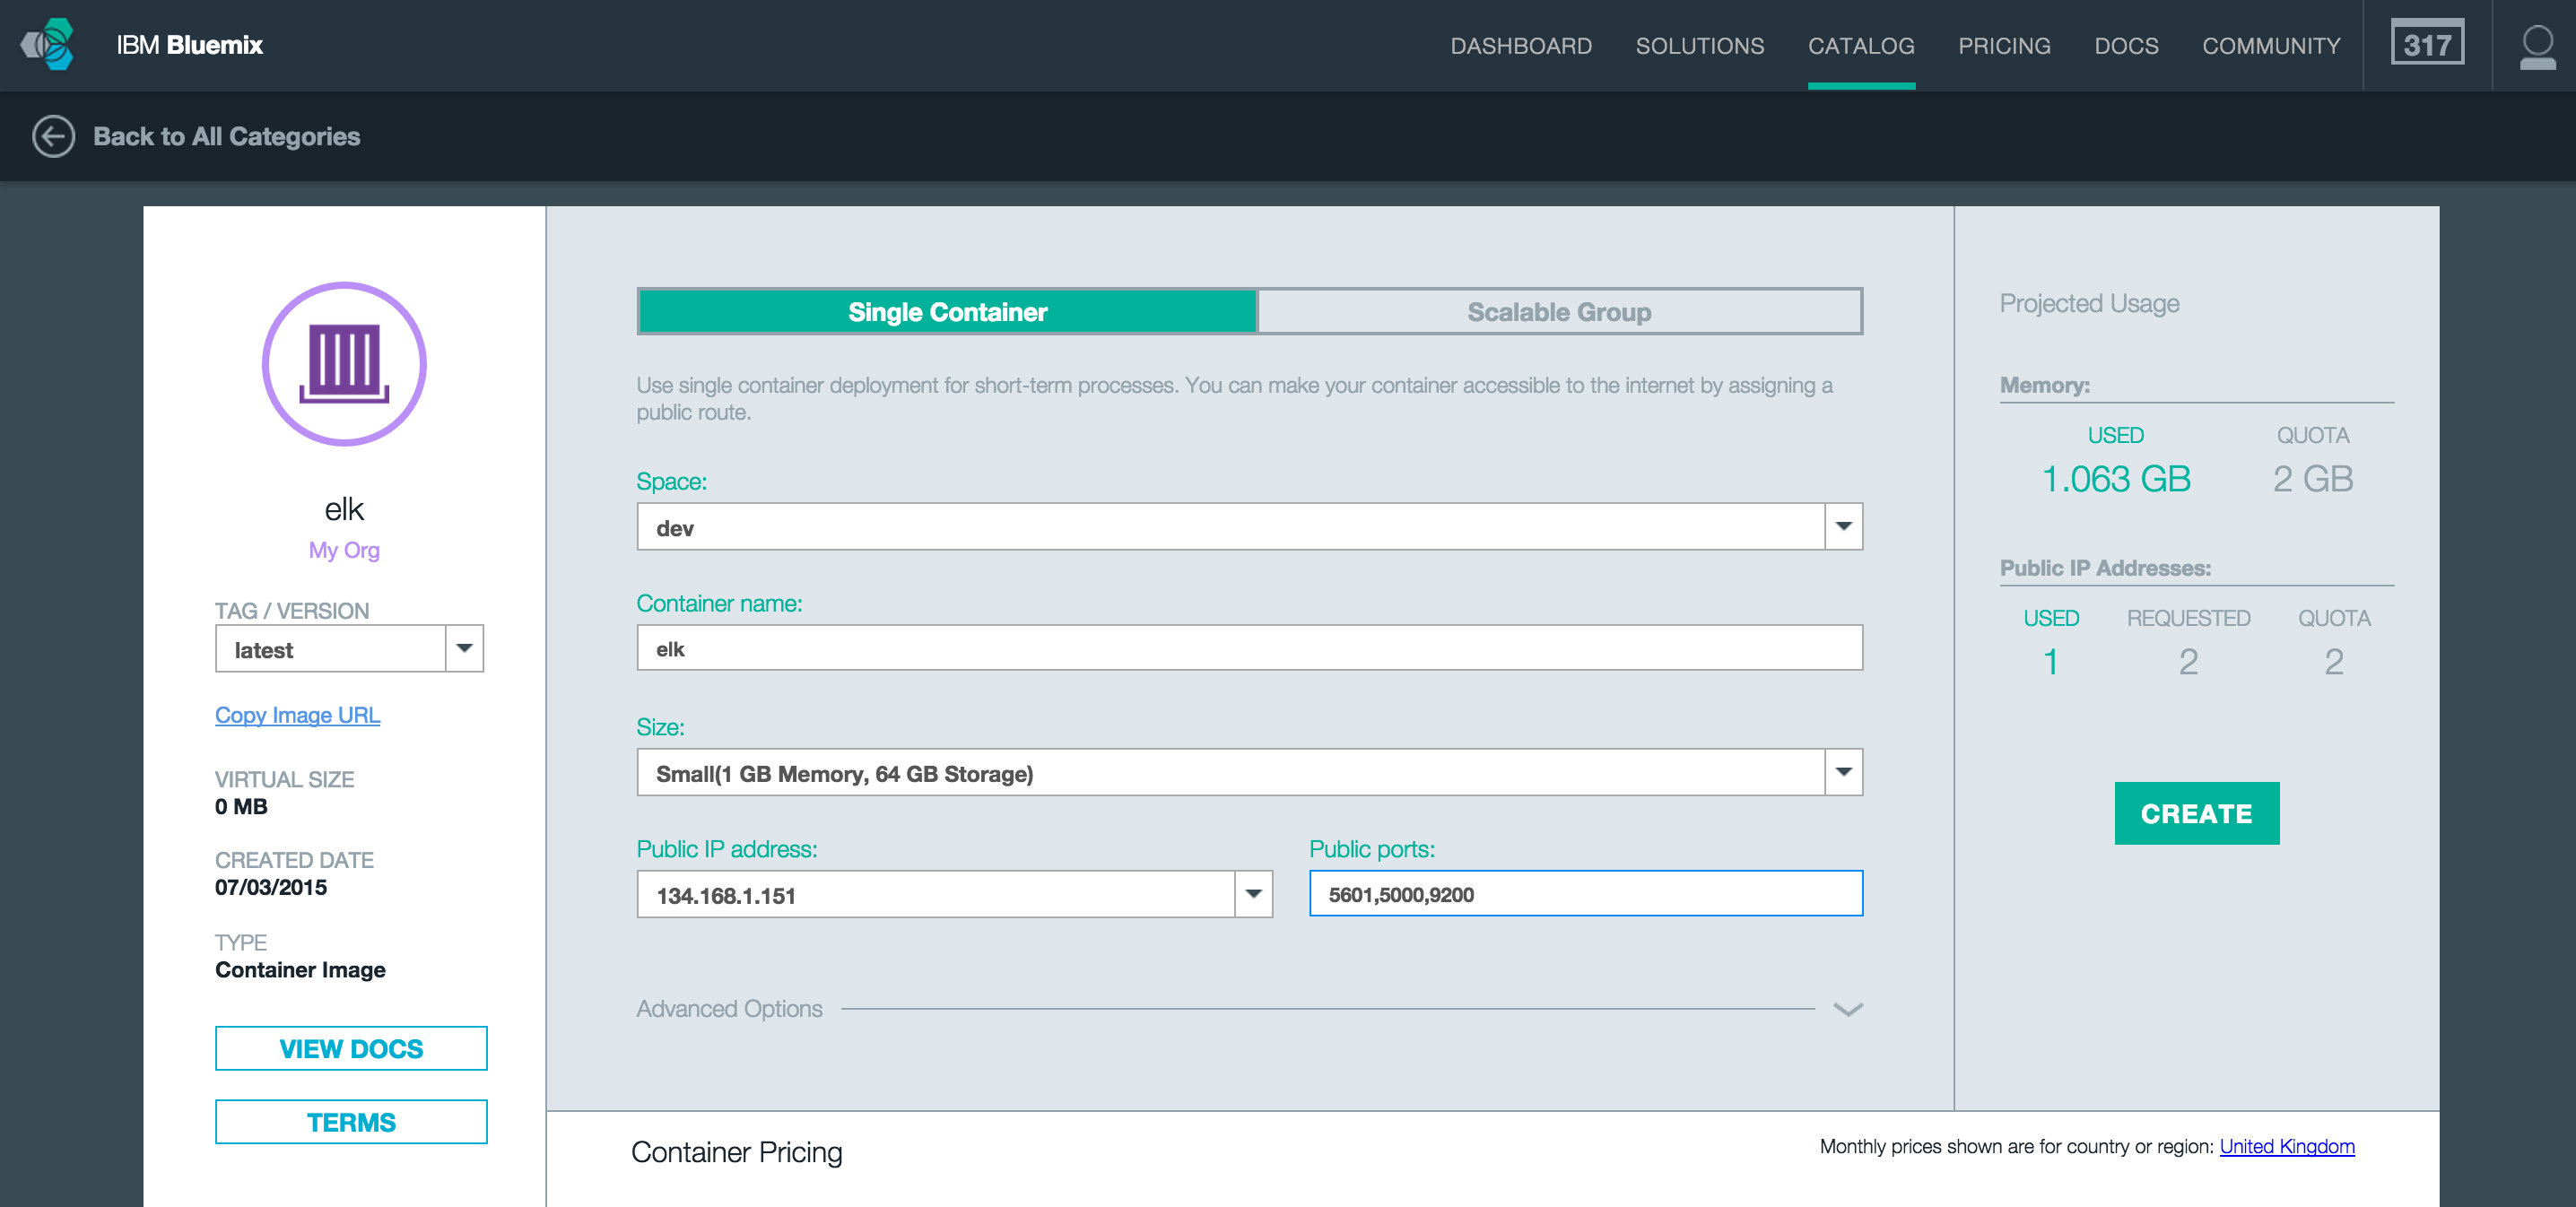
Clicking the Create button, IBM Bluemix will provision and start our new container.
Once the container has started, we can view the Dashboard page for this instance. Here we can view details about the container instance, modify the running state and access monitoring and logs tools.
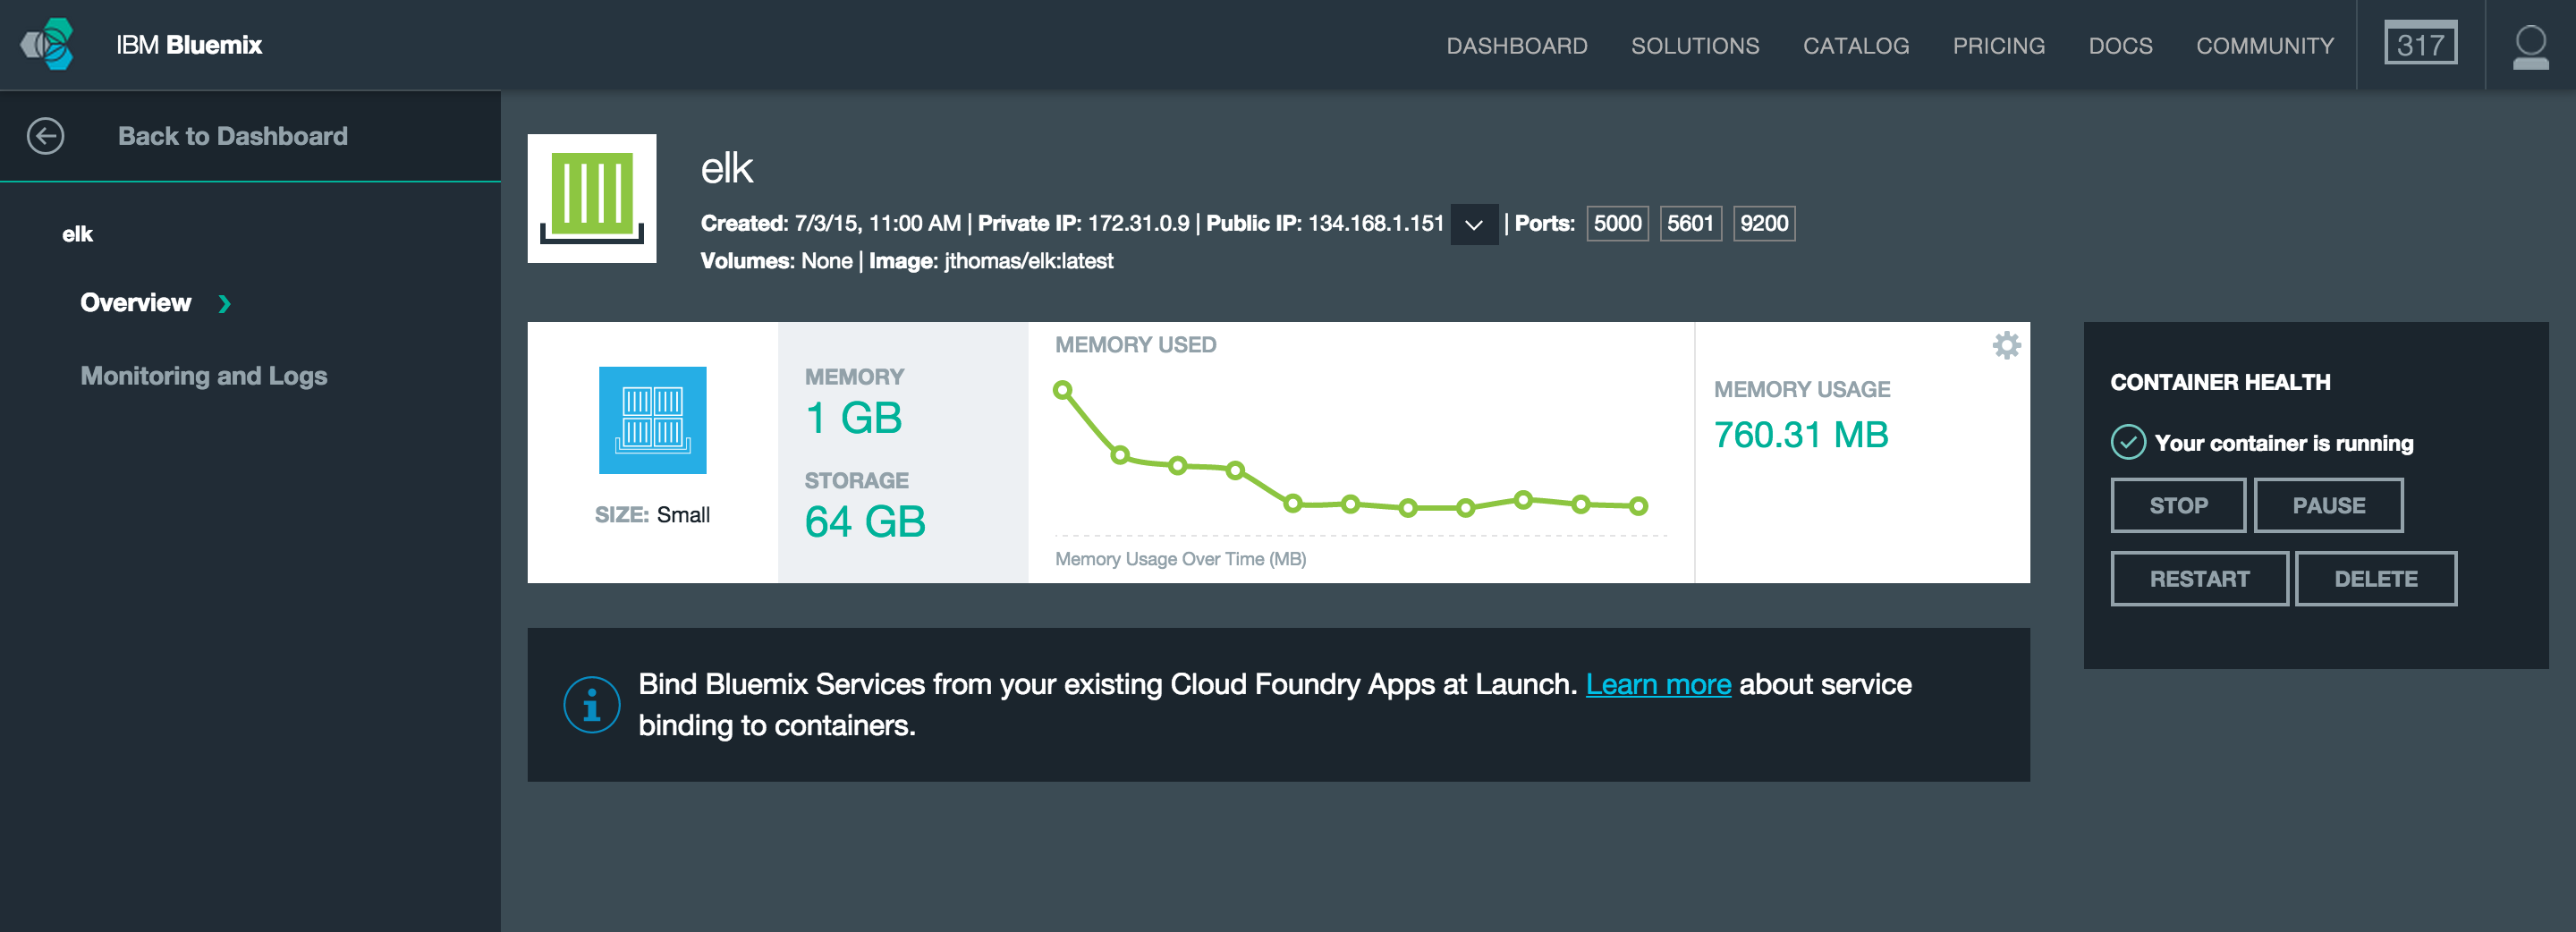
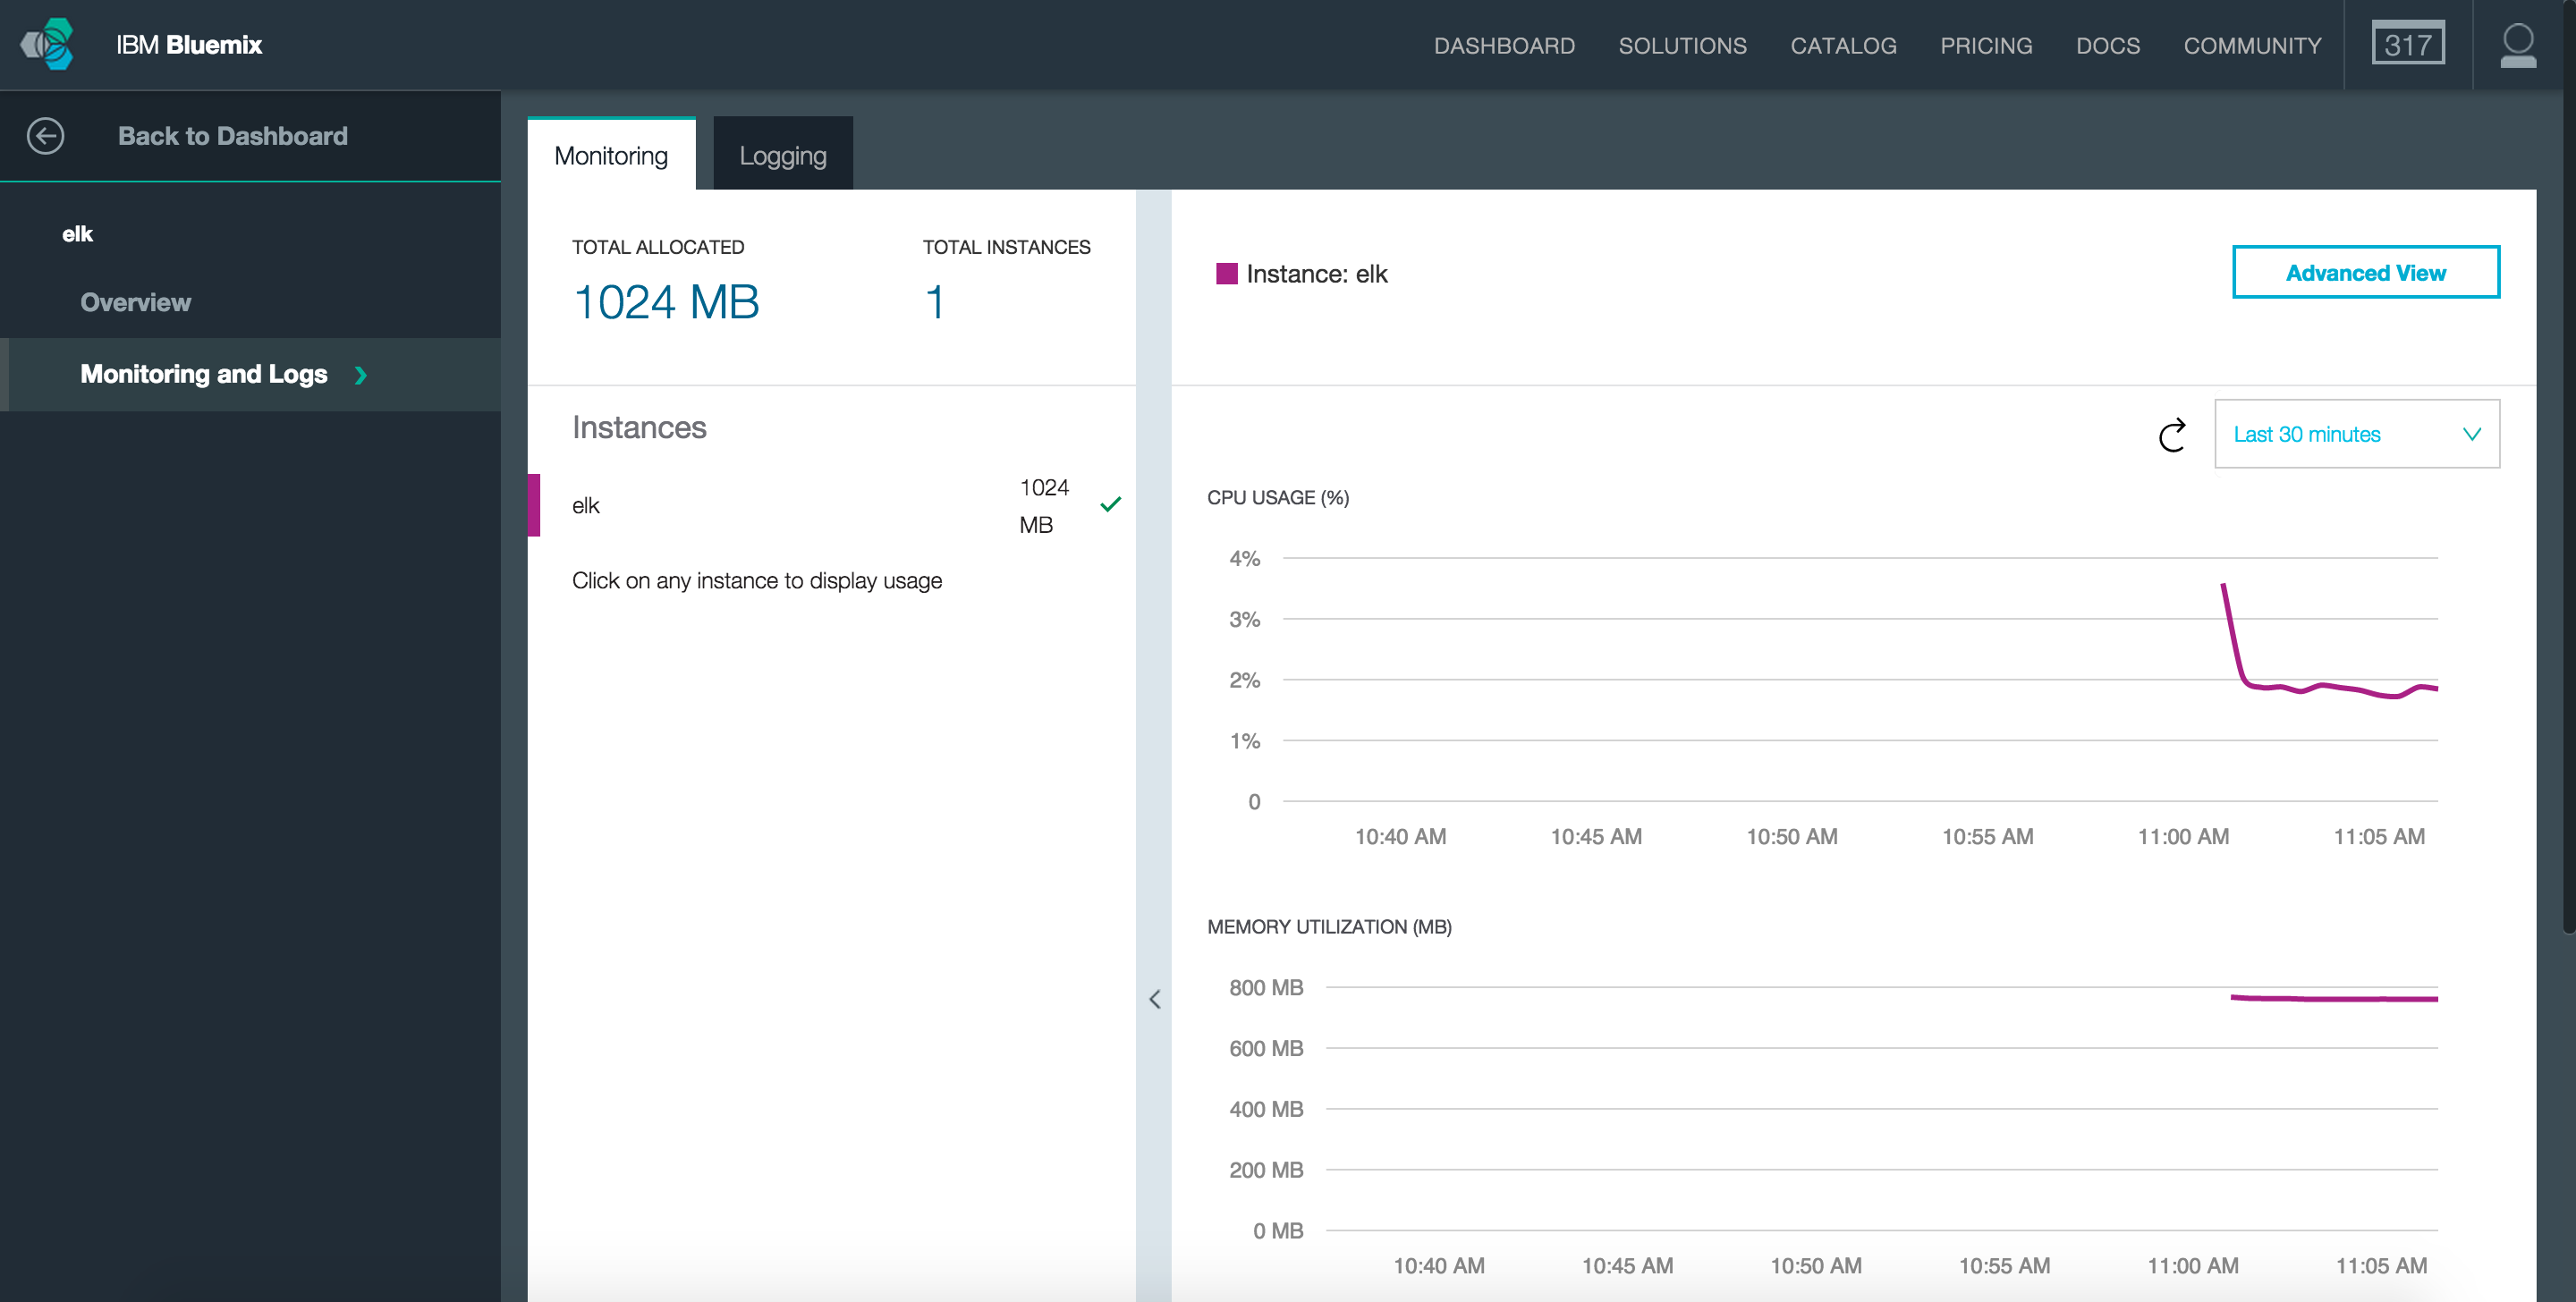
…and that’s it! We now have our ELK service running using IBM Containers ready to start processing logs from our applications.
Visiting the external IP address assigned to the container on the Kibana application port (5601) shows the Kibana web interface demonstrating our container has started correctly.
Draining Cloud Foundry Logs
Cloud Foundry supports draining applications logs to a third-party syslog service. The ELK container has a syslog drain configured on port 5000 of the public IP address bound to the instance.
Binding this custom syslog drain to Cloud Foundry applications uses a custom user-provided service. Creating user-provided services using the CF CLI, there is a special flag, -l, that notifies the platform this service is a syslog drain. Binding this special syslog drain service to an application will automatically set up log forwarding. Once the application has been restarted, logs will start to flow into the external service.
$ cf cups logstash-drain -l syslog://[CONTAINER_IP]:5000
$ cf bind-service [app-name] logstash-drain
$ cf restart [app-name]
Cloud Foundry supports multiple syslog drains for the same application.
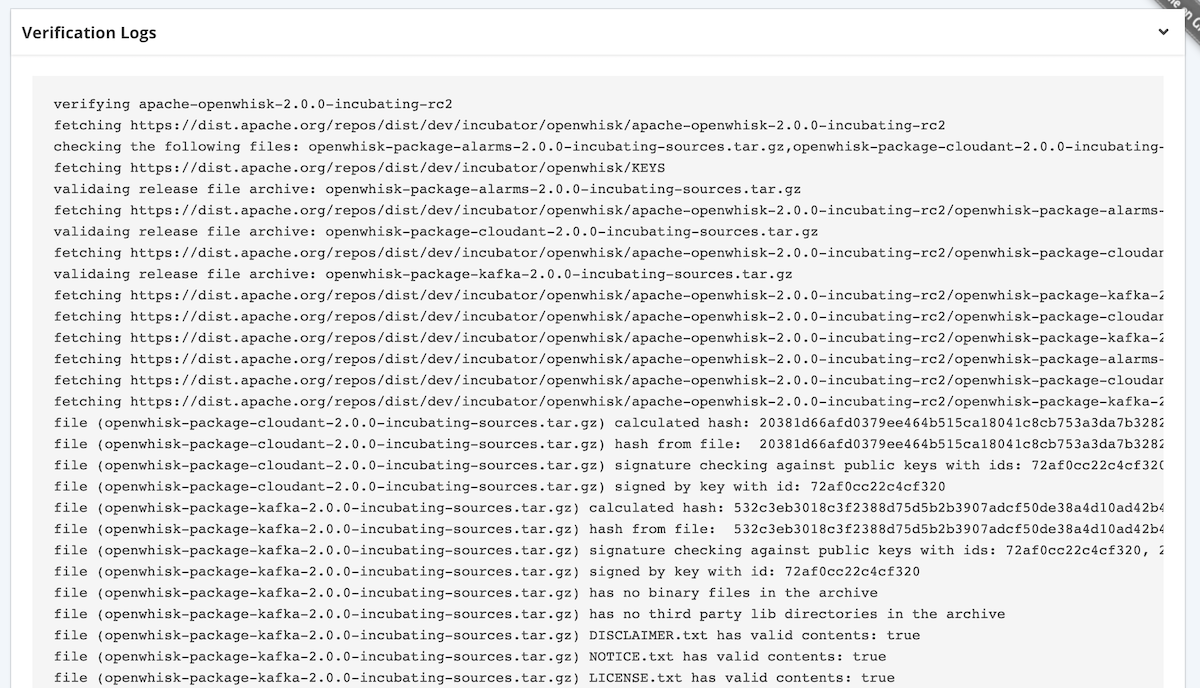
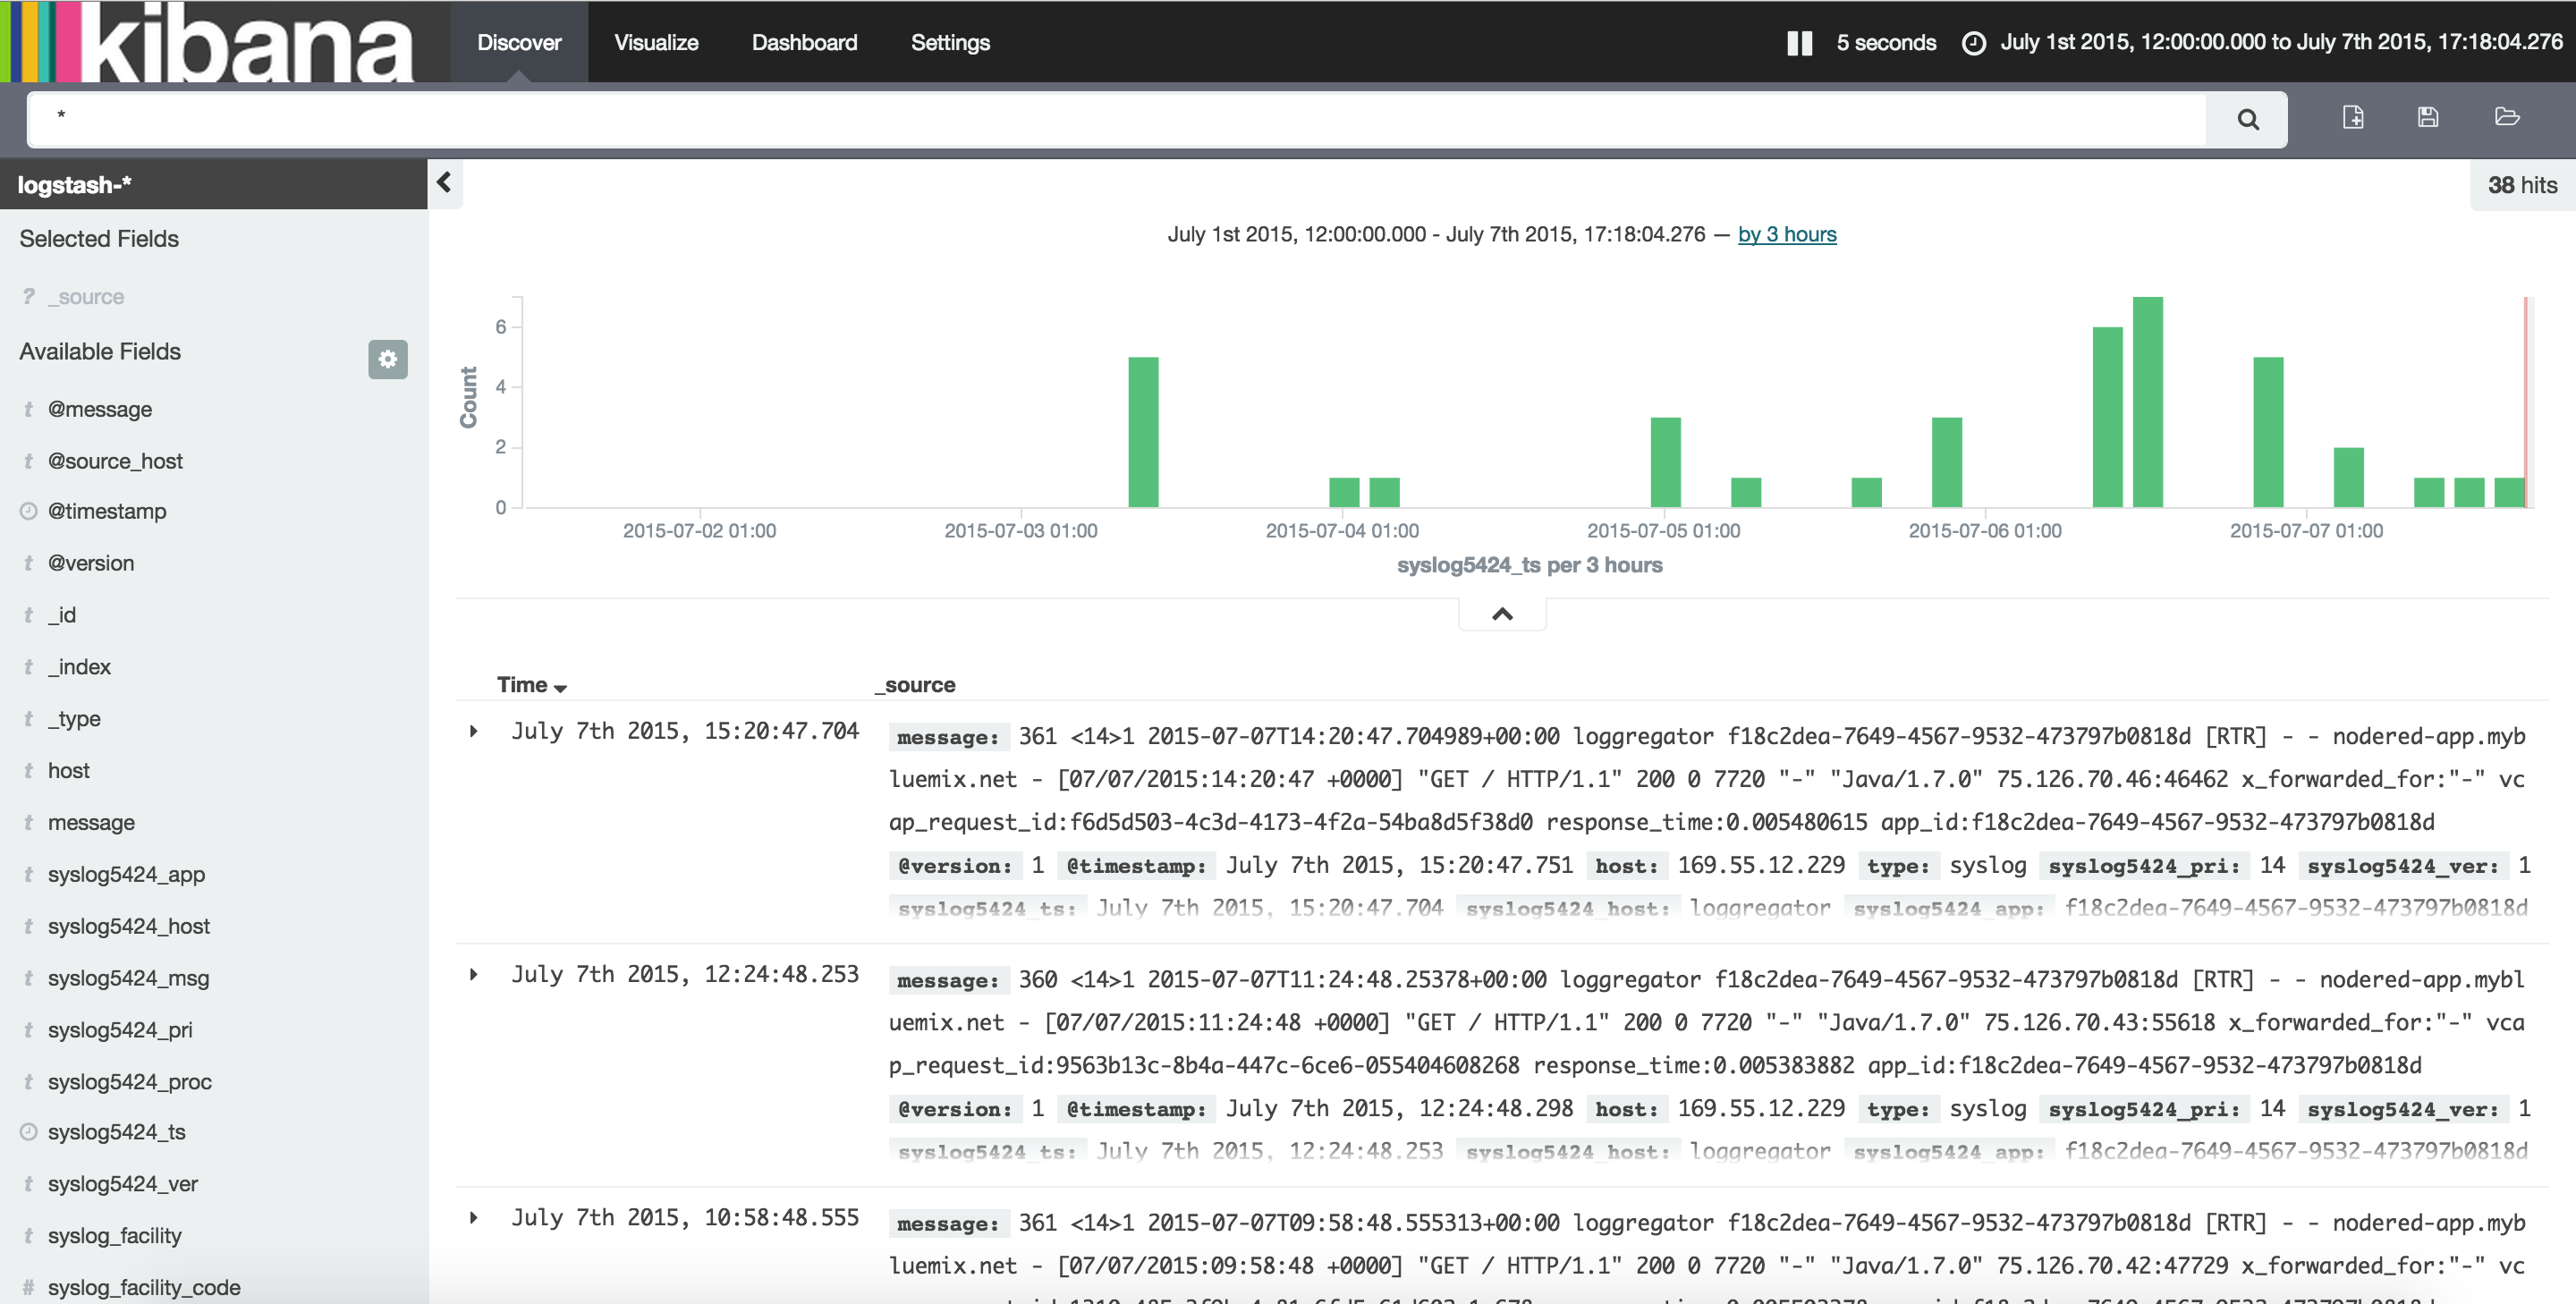
Testing this out is as simple as visiting our application to generate sample logs and then looking at the Kibana page to see they are showing up. Here is a screenshot of the expected output when our ELK container is successfully processing logs from a Cloud Foundry application.
Conclusion
Elastic Search, Kibana and Logstash is the modern log processing framework. Using Docker, we’ve been able to create a custom ELK service without manually installing and configuring a multitude of different software packages. Pushing this image to the IBM Containers platform means we can spin up new ELK containers on-demand within minutes!
Elasticsearch, Docker and IBM Containers… Making Logs Awesome.