
Following all the events from the World Cup can be hard. So many matches, so many goals. Rather than manually refreshing BBC Football to check the scores, I decided to created a Twitter bot that would automatically tweet out each goal.

The Twitter bot runs on IBM Cloud Functions. It is called once a minute to check for new goals, using the alarm trigger feed. If new goals have been scored, it calls another action to send the tweet messages.
⚽️ GOAL ⚽️
— WC 2018 Goal Bot (@WC2018_Goals) July 7, 2018
👨 Harry MAGUIRE (🏴 ) @ 30'. 👨
🏟 Sweden 🇸🇪 (0) v England 🏴 (1) 🏟#WorldCup
Once it was running, I need to ensure it was working correctly for the duration of the tournament. Using the IBM Cloud Logging service, I built a custom monitoring dashboard to help to me recognise and diagnose issues.
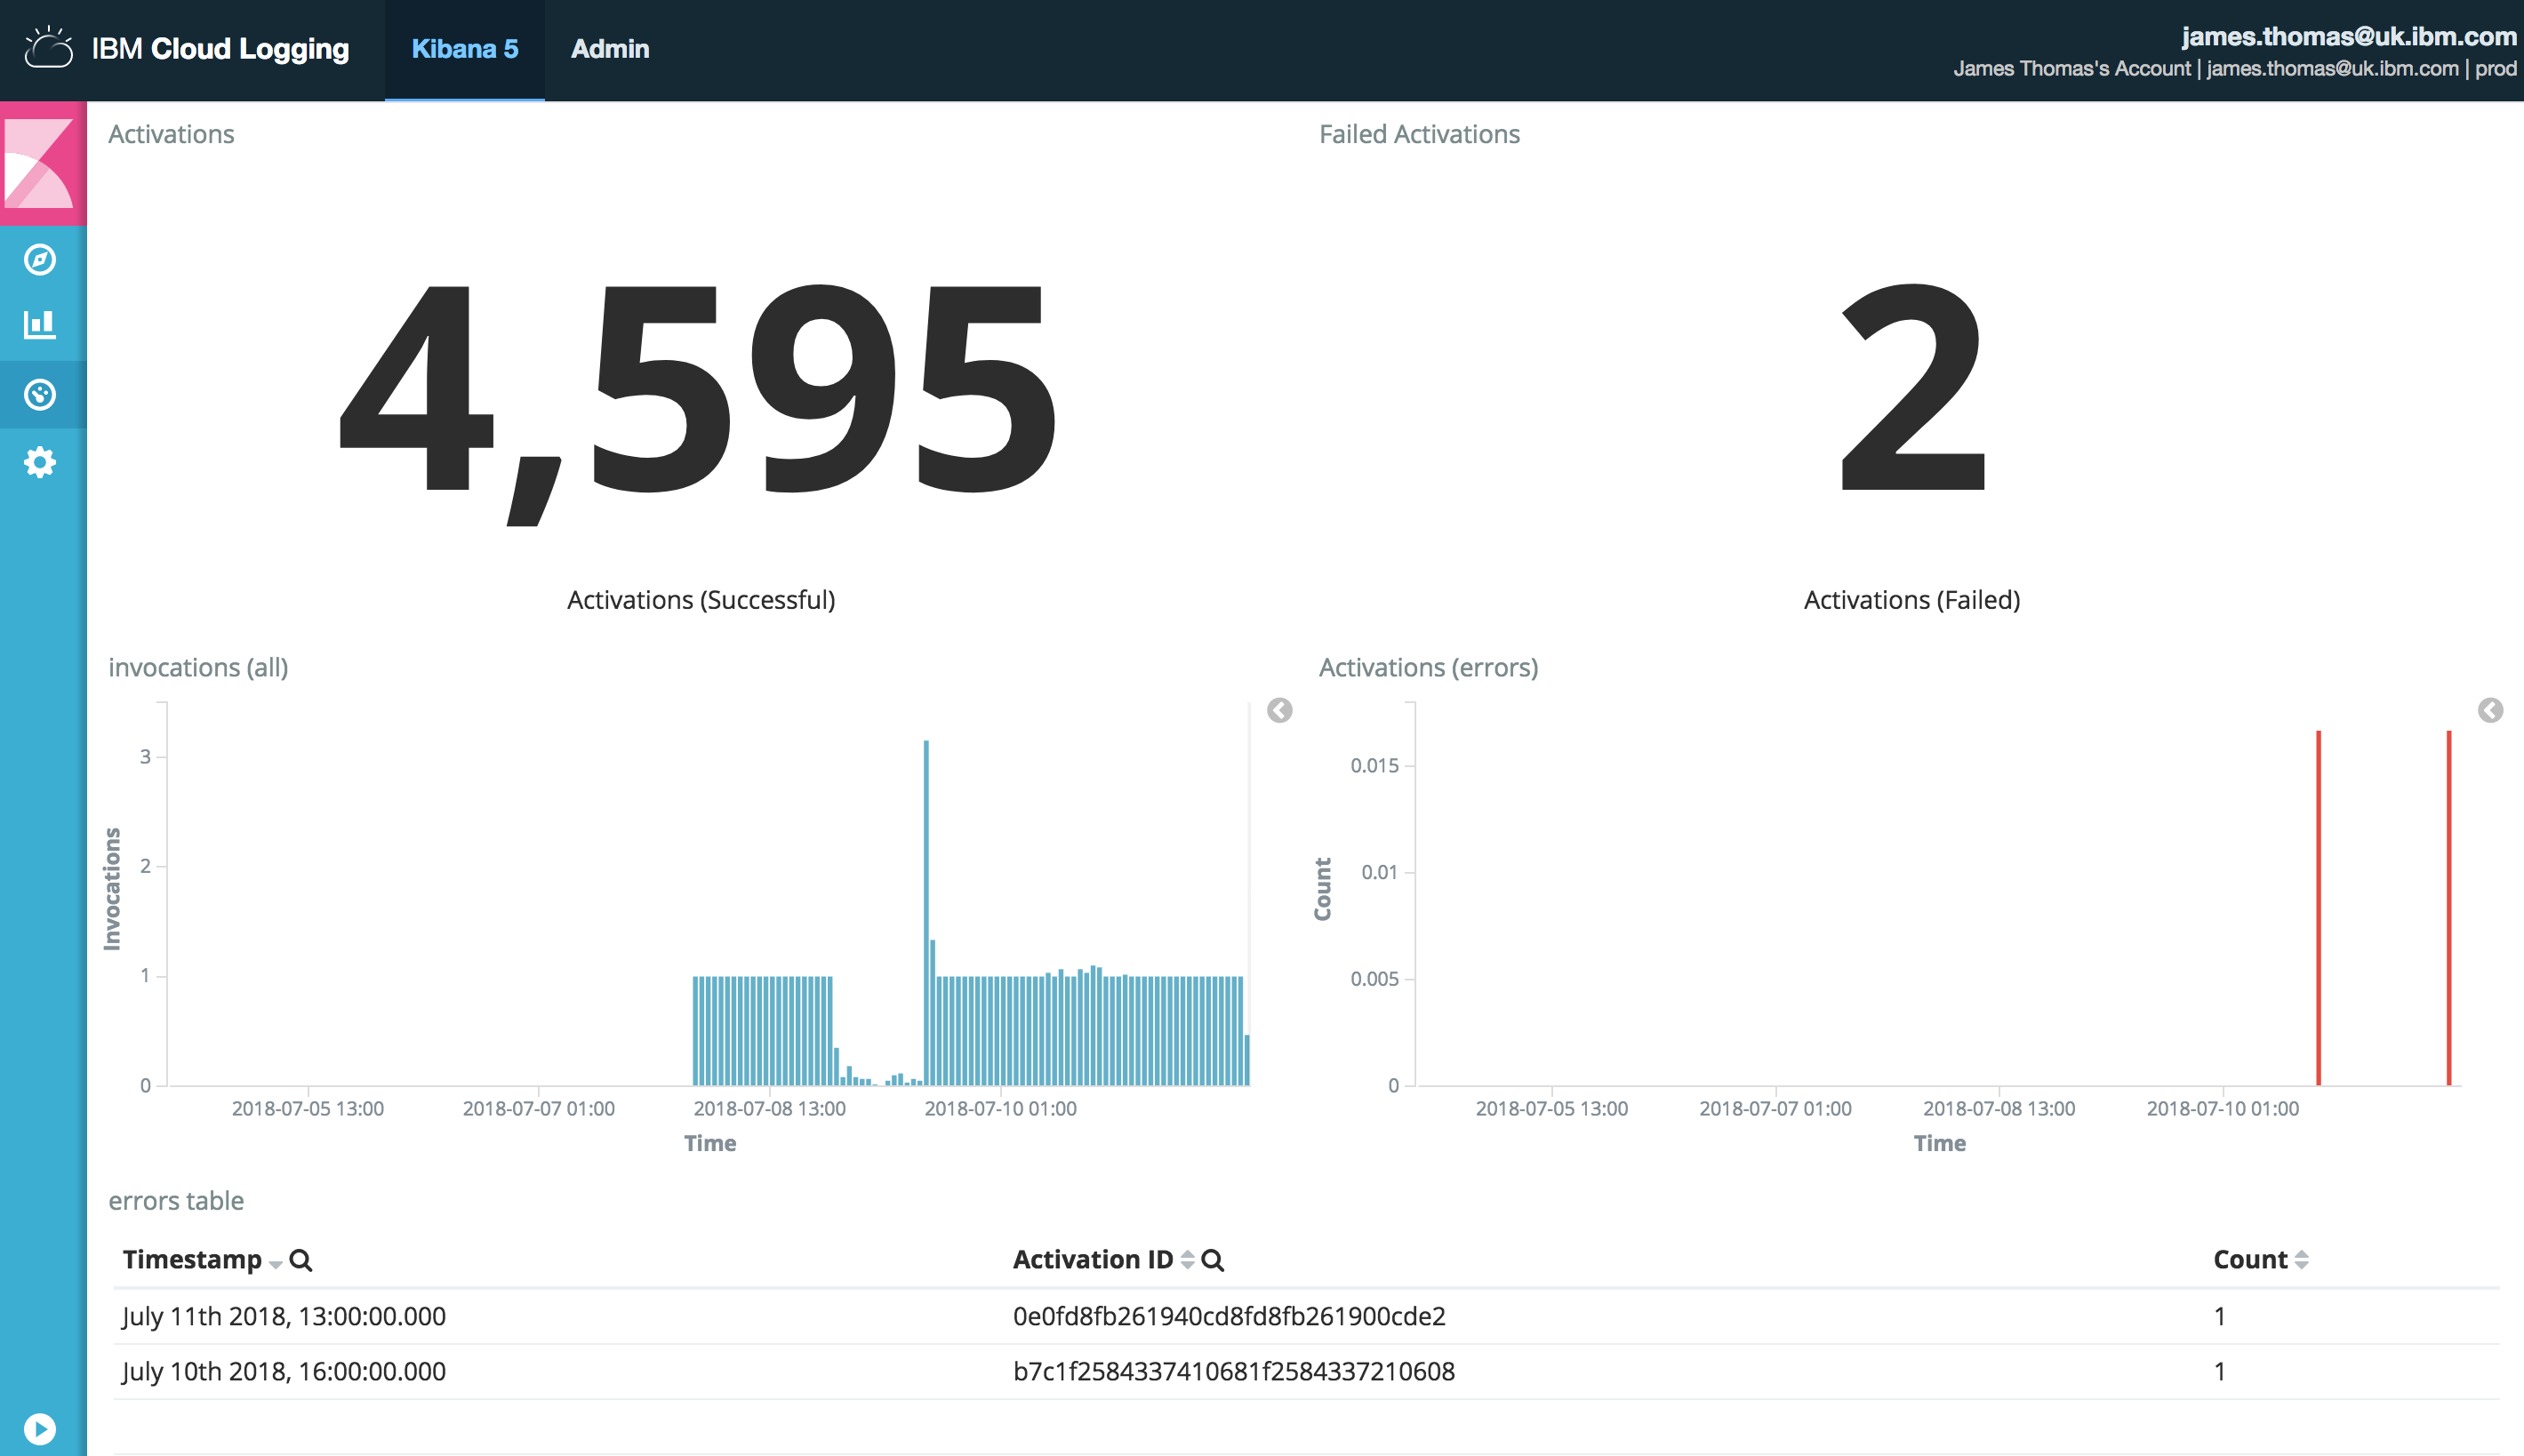
The dashboard showed counts for successful and failed activations, when they occurred and a list of failed activations. If issues have occurred, I can retrieve the failed activation identifiers and investigate further.
Let’s walk through the steps used to create this dashboard to help you create custom visualisations for serverless applications running on IBM Cloud Functions…
IBM Cloud Logging
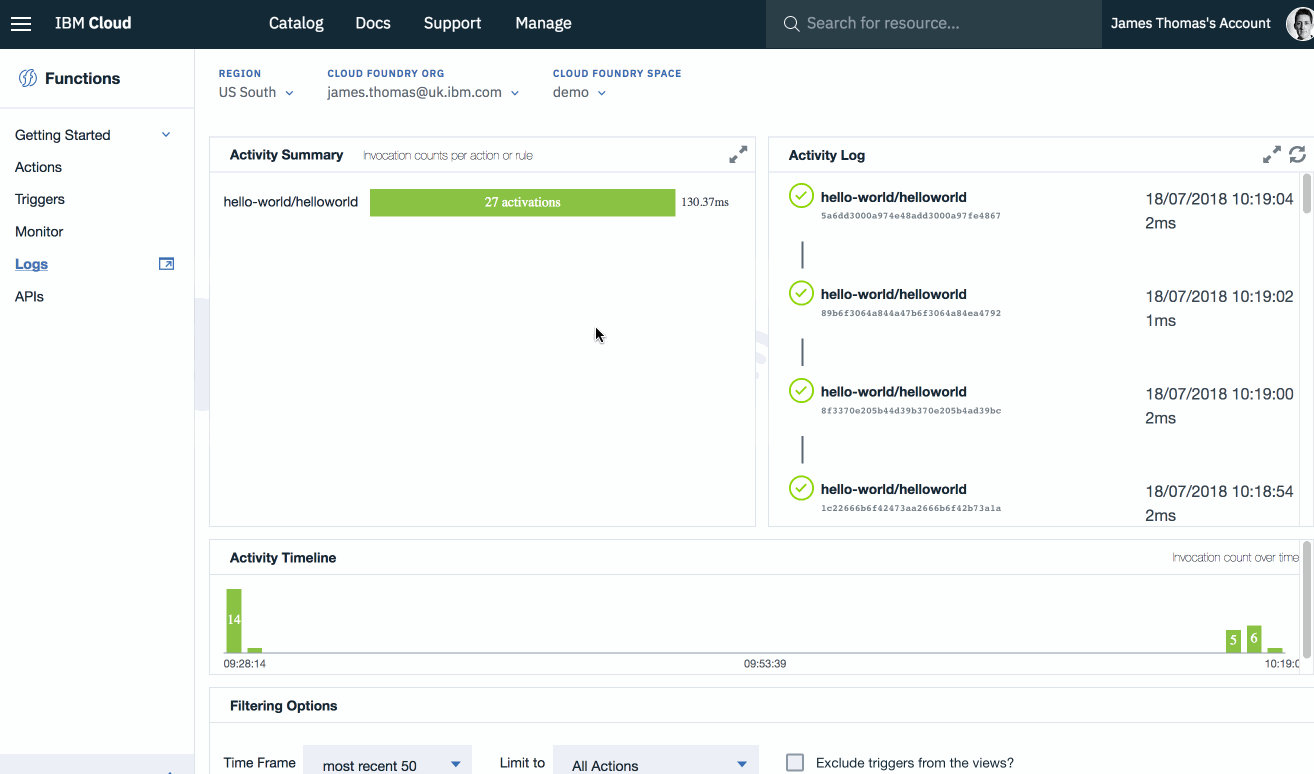
IBM Cloud Logging can be accessed using the link on the IBM Cloud Functions dashboard. This will open the logging service for the current organisation and space.
All activation records and application logs are automatically forwarded to the logging service by IBM Cloud Functions.
Log Message Fields
Activation records and application log messages have a number of common record fields.
activationId_str- activation identifier for log message.timestamp- log draining time.@timestamp- message ingestion time.action_str- fully qualified action name
Log records for different message types are identified using the type field. This is either activation_record or user_logs for IBM Cloud Functions records.
Activation records have the following custom fields.
duration_int- activation duration in millisecondsstatus_str- activation status response (non-zero for errors)message- activation response returned from actiontime_date- activation record start timeend_date- activation record end time
Applications log lines, written to stdout or stderr, are forwarded as individual records. One application log line per record. Log message records have the following custom fields.
message- single application log line outputstream_str- log message source, eitherstdoutorstderrtime_date- timestamp parsed from application log line
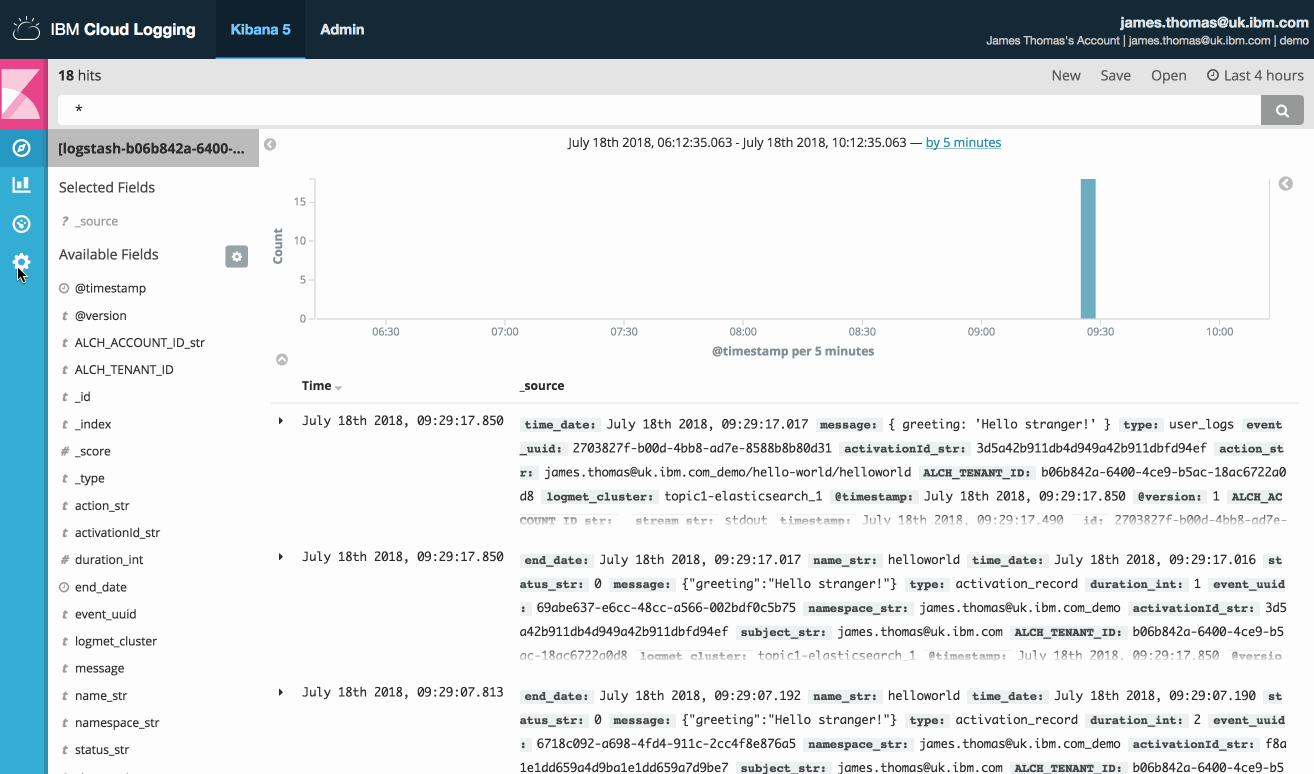
Finding Log Messages For One Activation
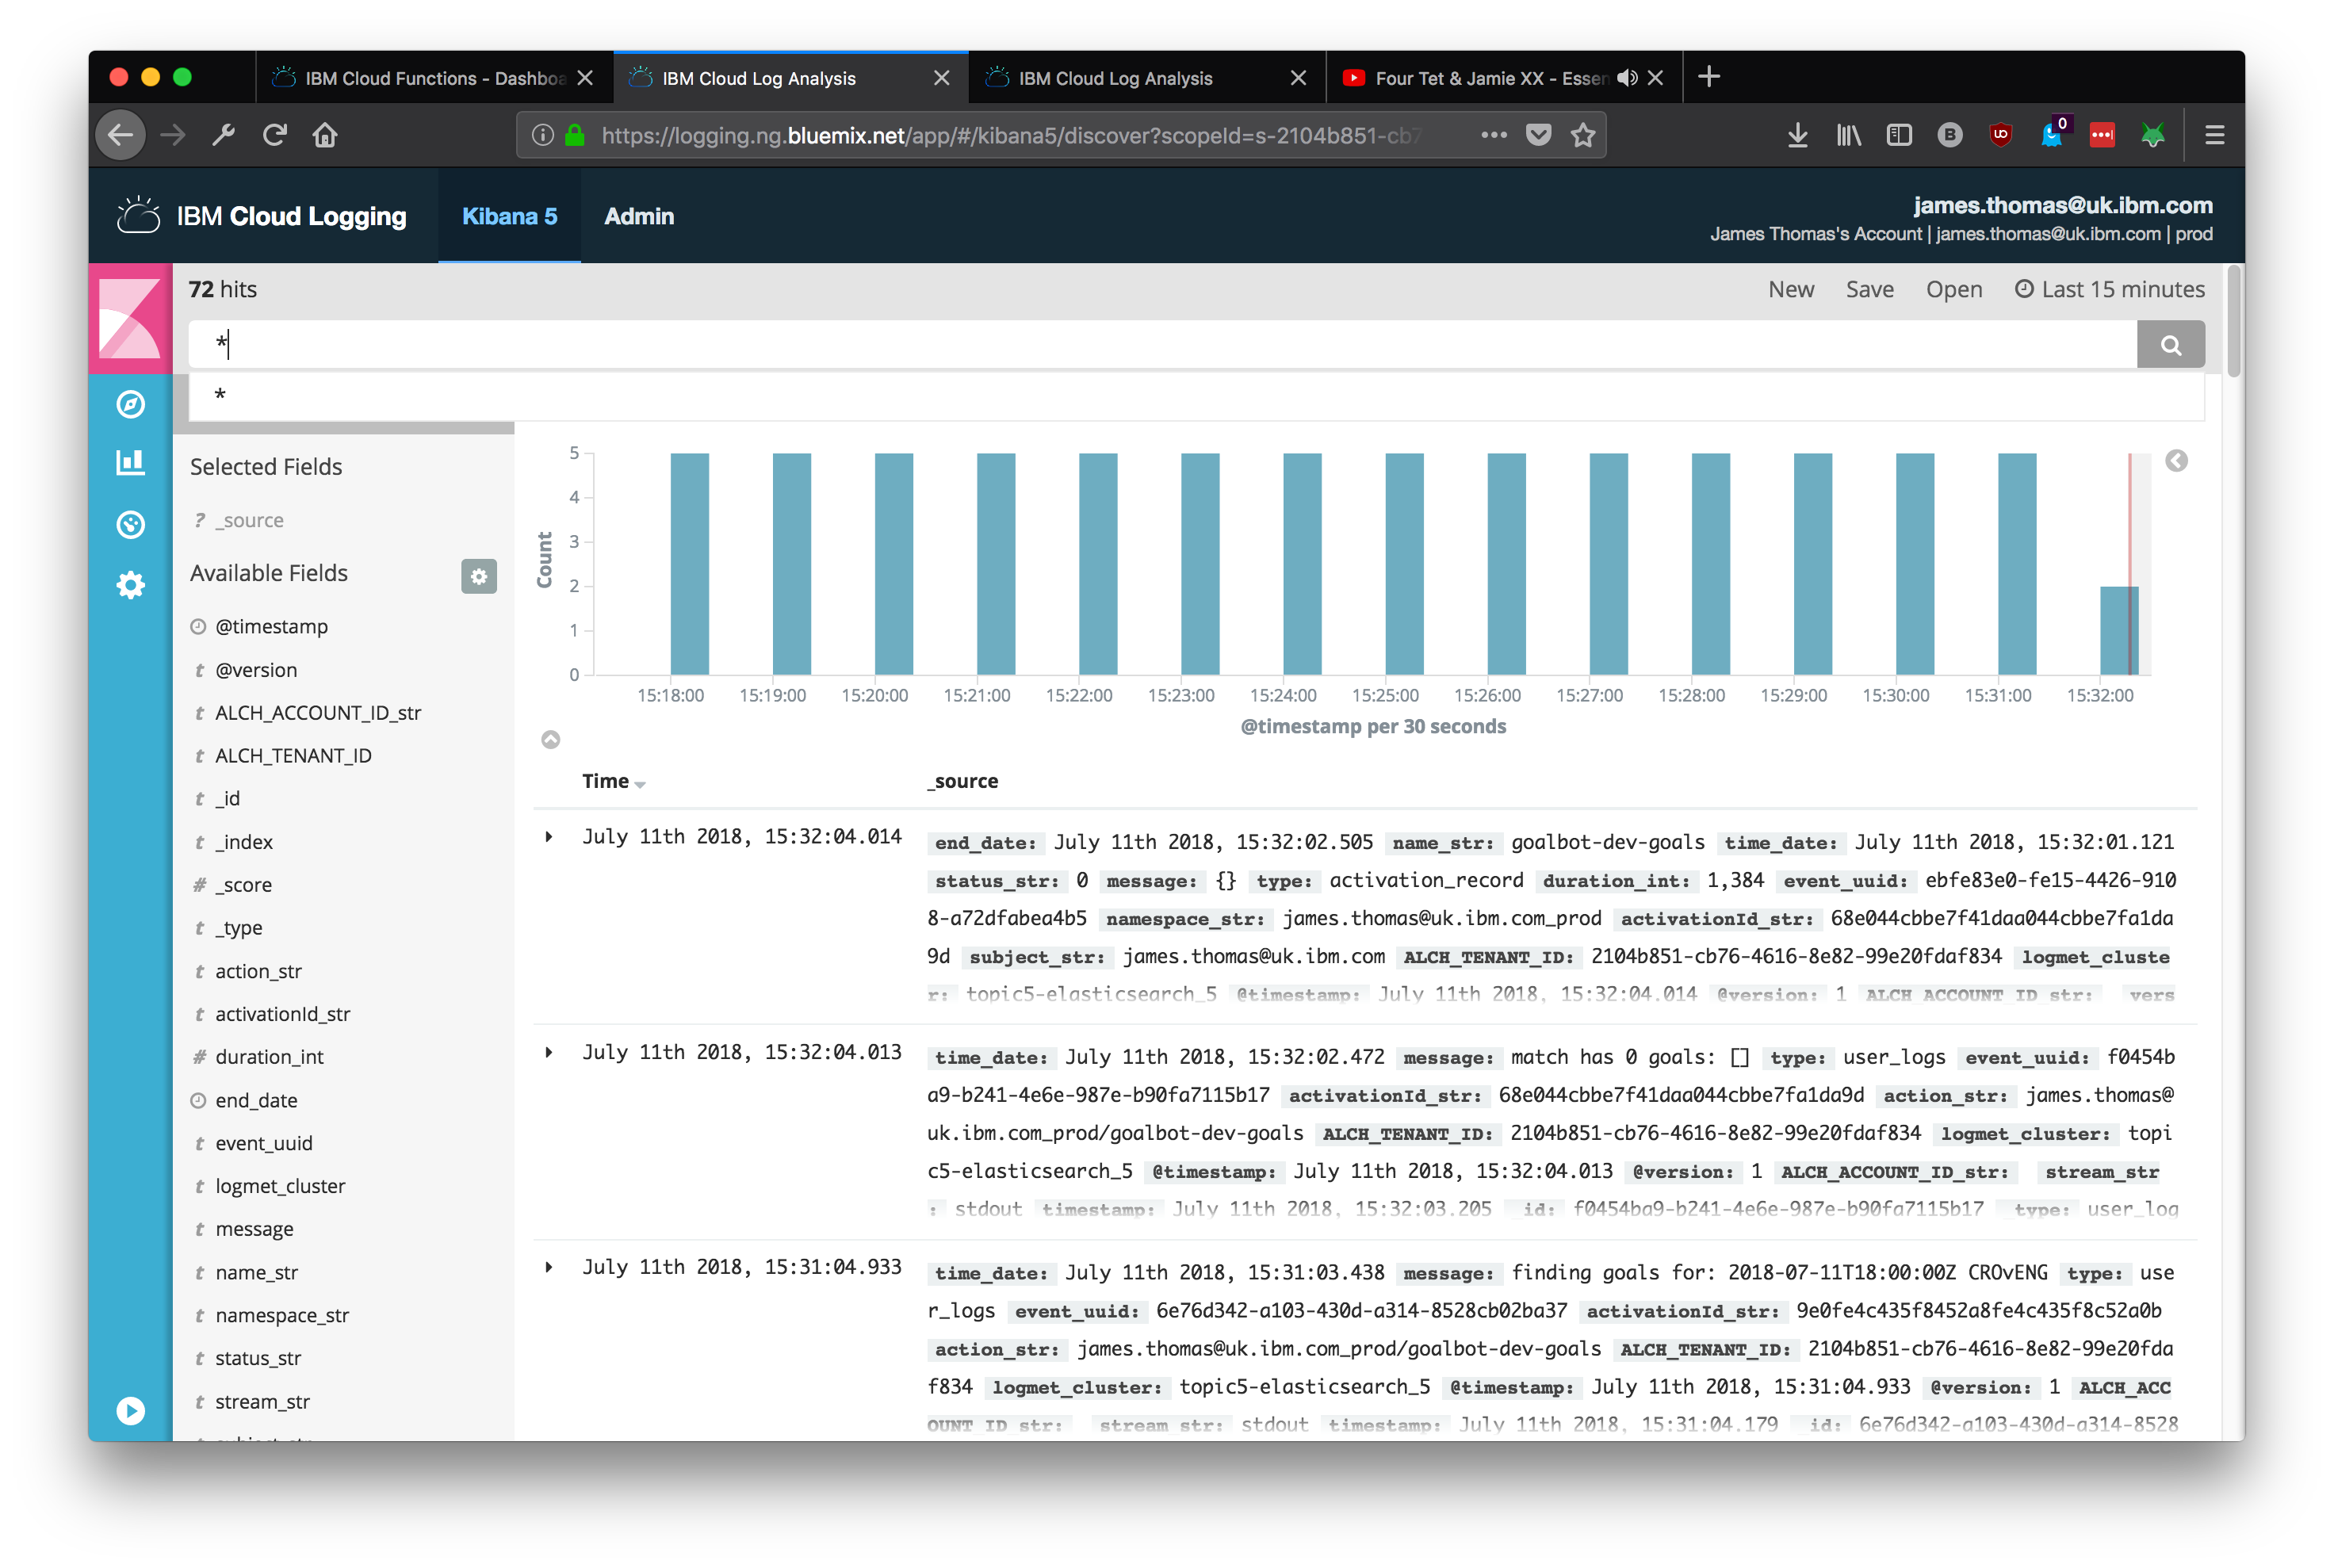
Use this query string in the “Discover" tab to retrieve all logs messages from a particular activation.
activationId_str: <ACTIVATION_ID>
Search queries are executed against log records within a configurable time window.
Monitoring Dashboard
This is the monitoring dashboard I created. It contains visualisations showing counts for successful and failed activations, histograms of when they occurred and a list of the recent failed activation identifiers.
It allows me to quickly review the previous 24 hours activations for issues. If there are notable issues, I can retrieve the failed activation identifiers and investigate further.
Before being able to create the dashboard, I needed to define two resources: saved searches and visualisations.
Saved Searches
Kibana supports saving and referring to search queries from visualisations using explicit names.
Using saved searches with visualisations, rather than explicit queries, removes the need to manually update visualisations’ configuration when queries change.
This dashboard uses two custom queries in visualisations. Queries are needed to find activation records from both successful and failed invocations.
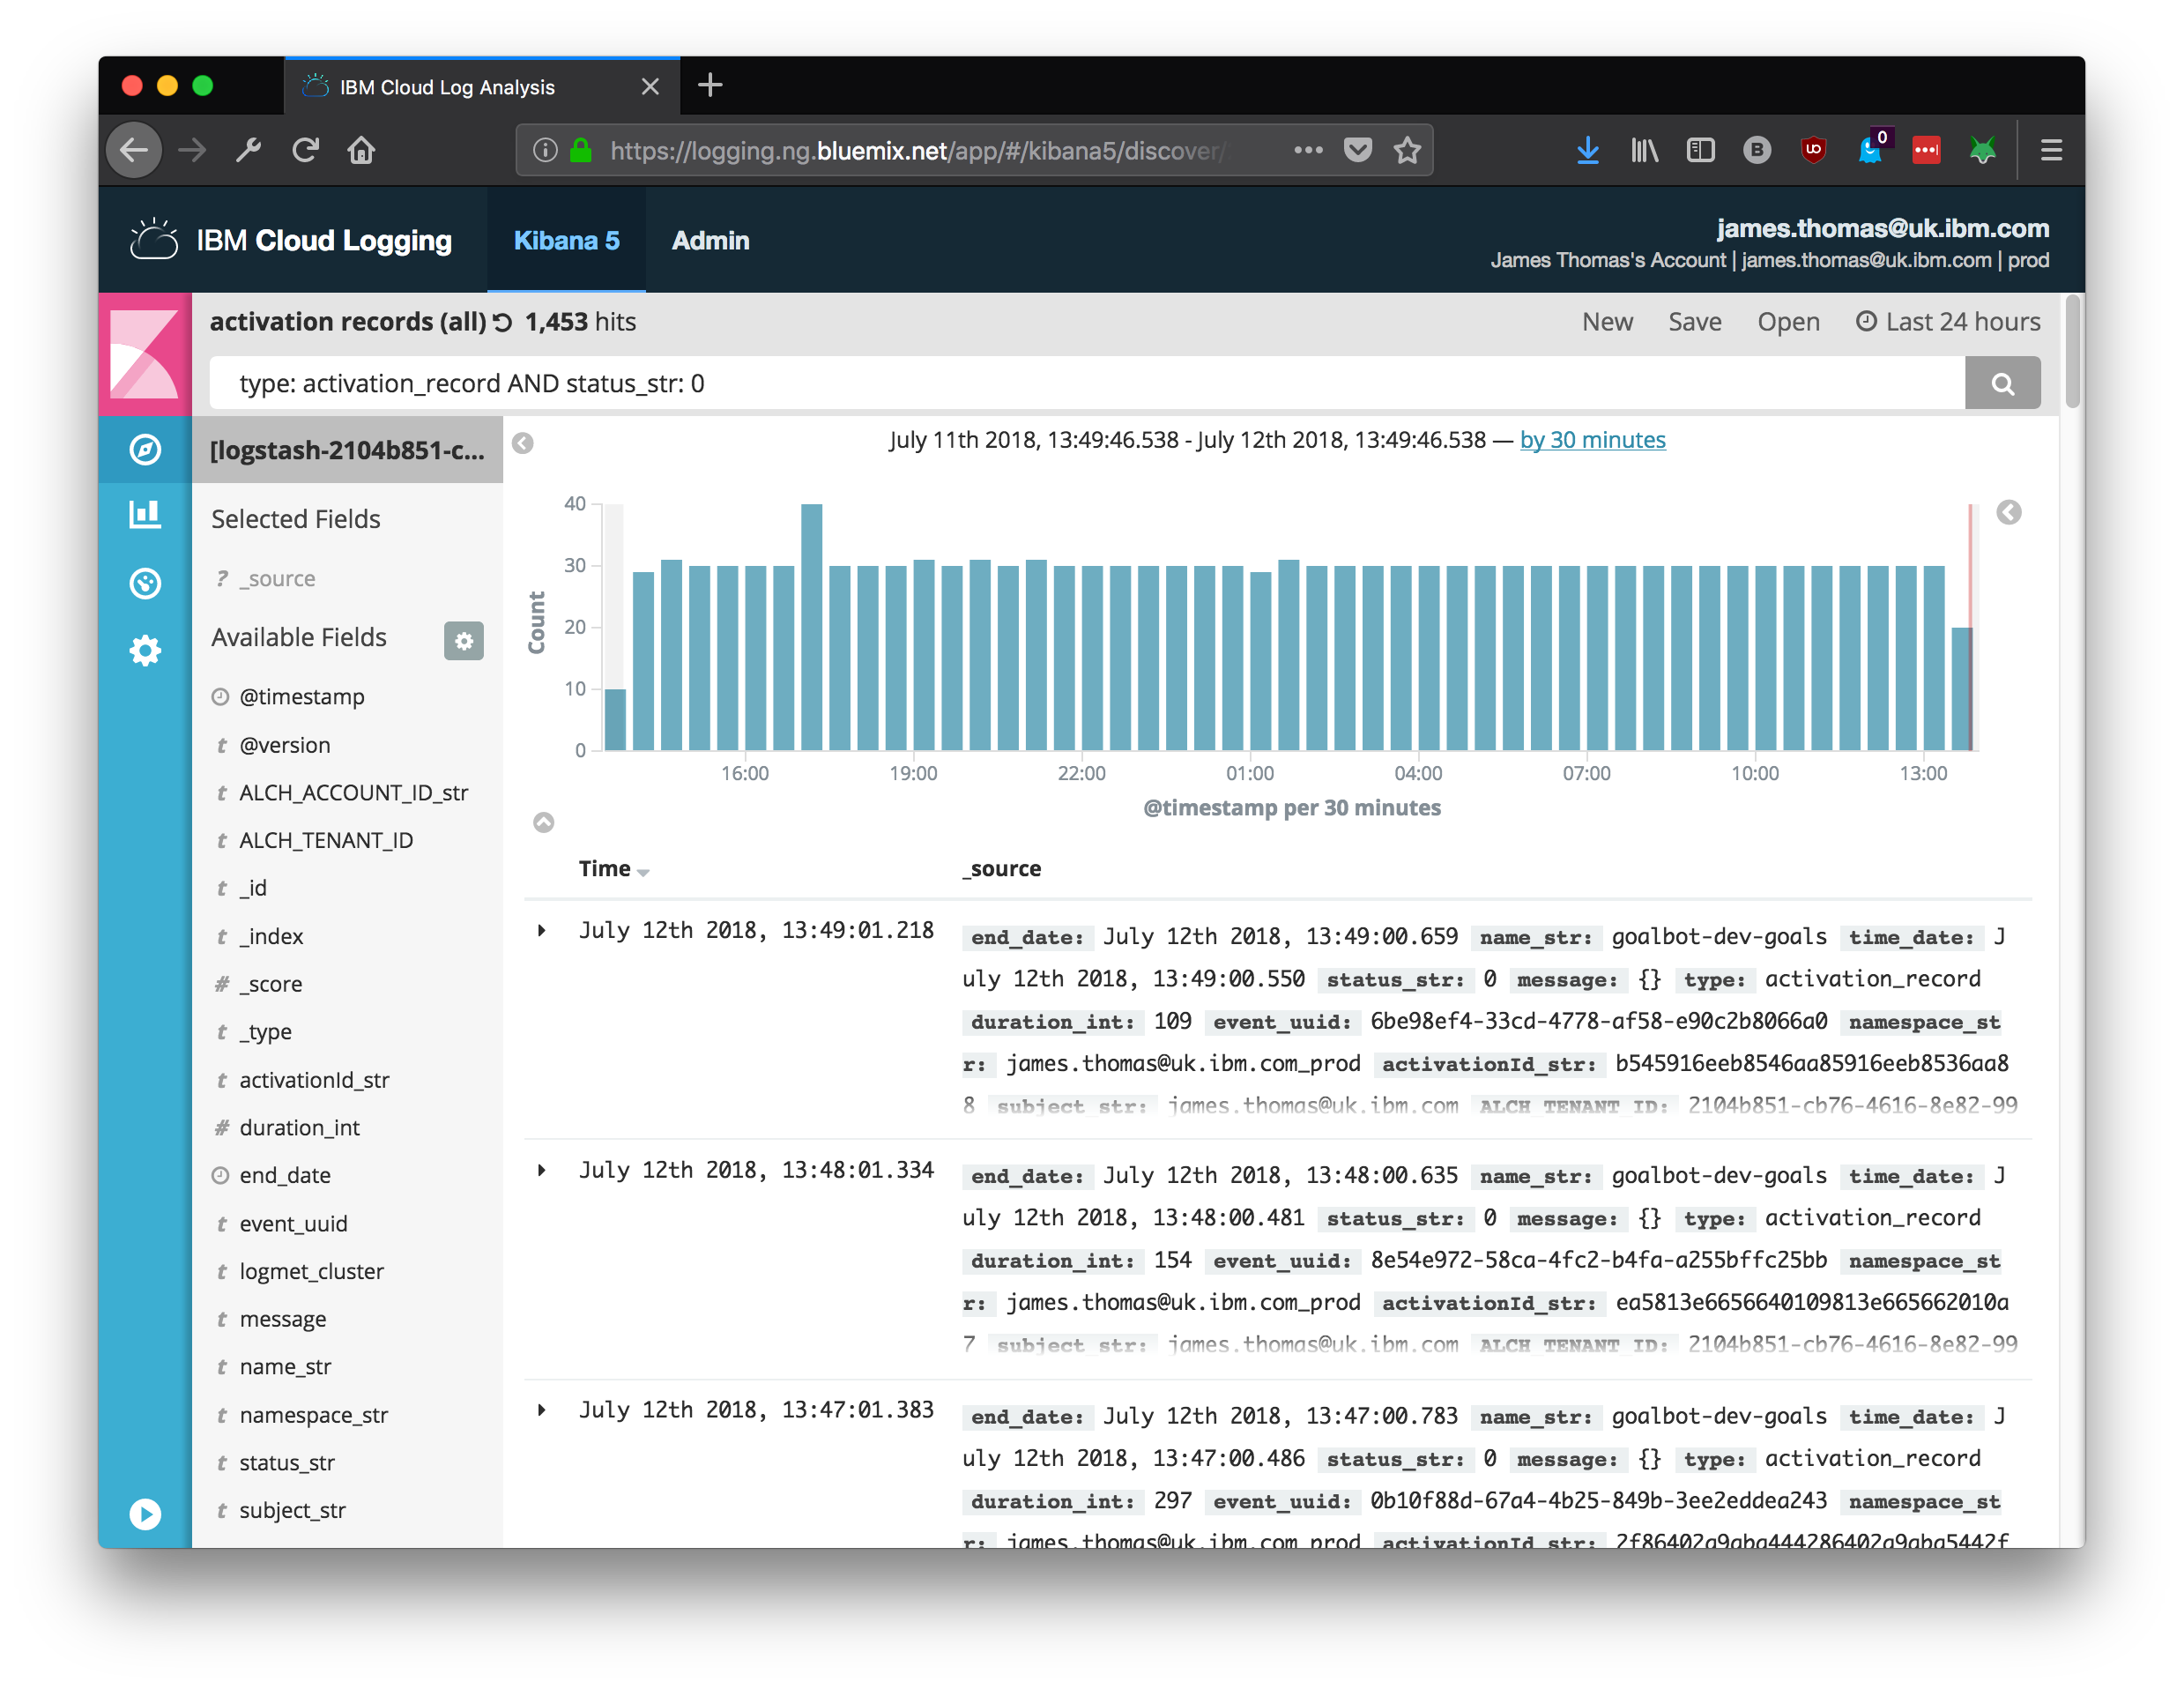
- Create a new “Saved Search” named “activation records (success)" using the following search query.
type: activation_record AND status_str: 0
- Create a new “Saved Search” named “activation records (failed)" using the following search query.
type: activation_record AND NOT status_str: 0
The status_str field is set to a non-zero value for failures. Using the type field ensures log messages from other sources are excluded from the results.
Indexed Fields
Before referencing log record fields in visualisations, those fields need to be indexed correctly. Use these instructions to verify activation records fields are available.
- Check IBM Cloud Functions logs are available in IBM Cloud Logging using the “Discover” tab.
- Click the “⚙️ (Management)” menu item on the left-hand drop-down menu in IBM Cloud Logging.
- Click the “Index Patterns” link.
- Click the 🔄 button to refresh the field list.
Visualisations
Three types of visualisation are used on the monitoring dashboard. Metric displays are used for the activation counts, vertical bar charts for the activation times and a data table to list failed activations.
Visualisations can be created by opening the “Visualize” menu item and select a new visualisation type under the “Create New Visualization” menu.
Create five different visualisations, using the instructions below, before moving on to create the dashboard.
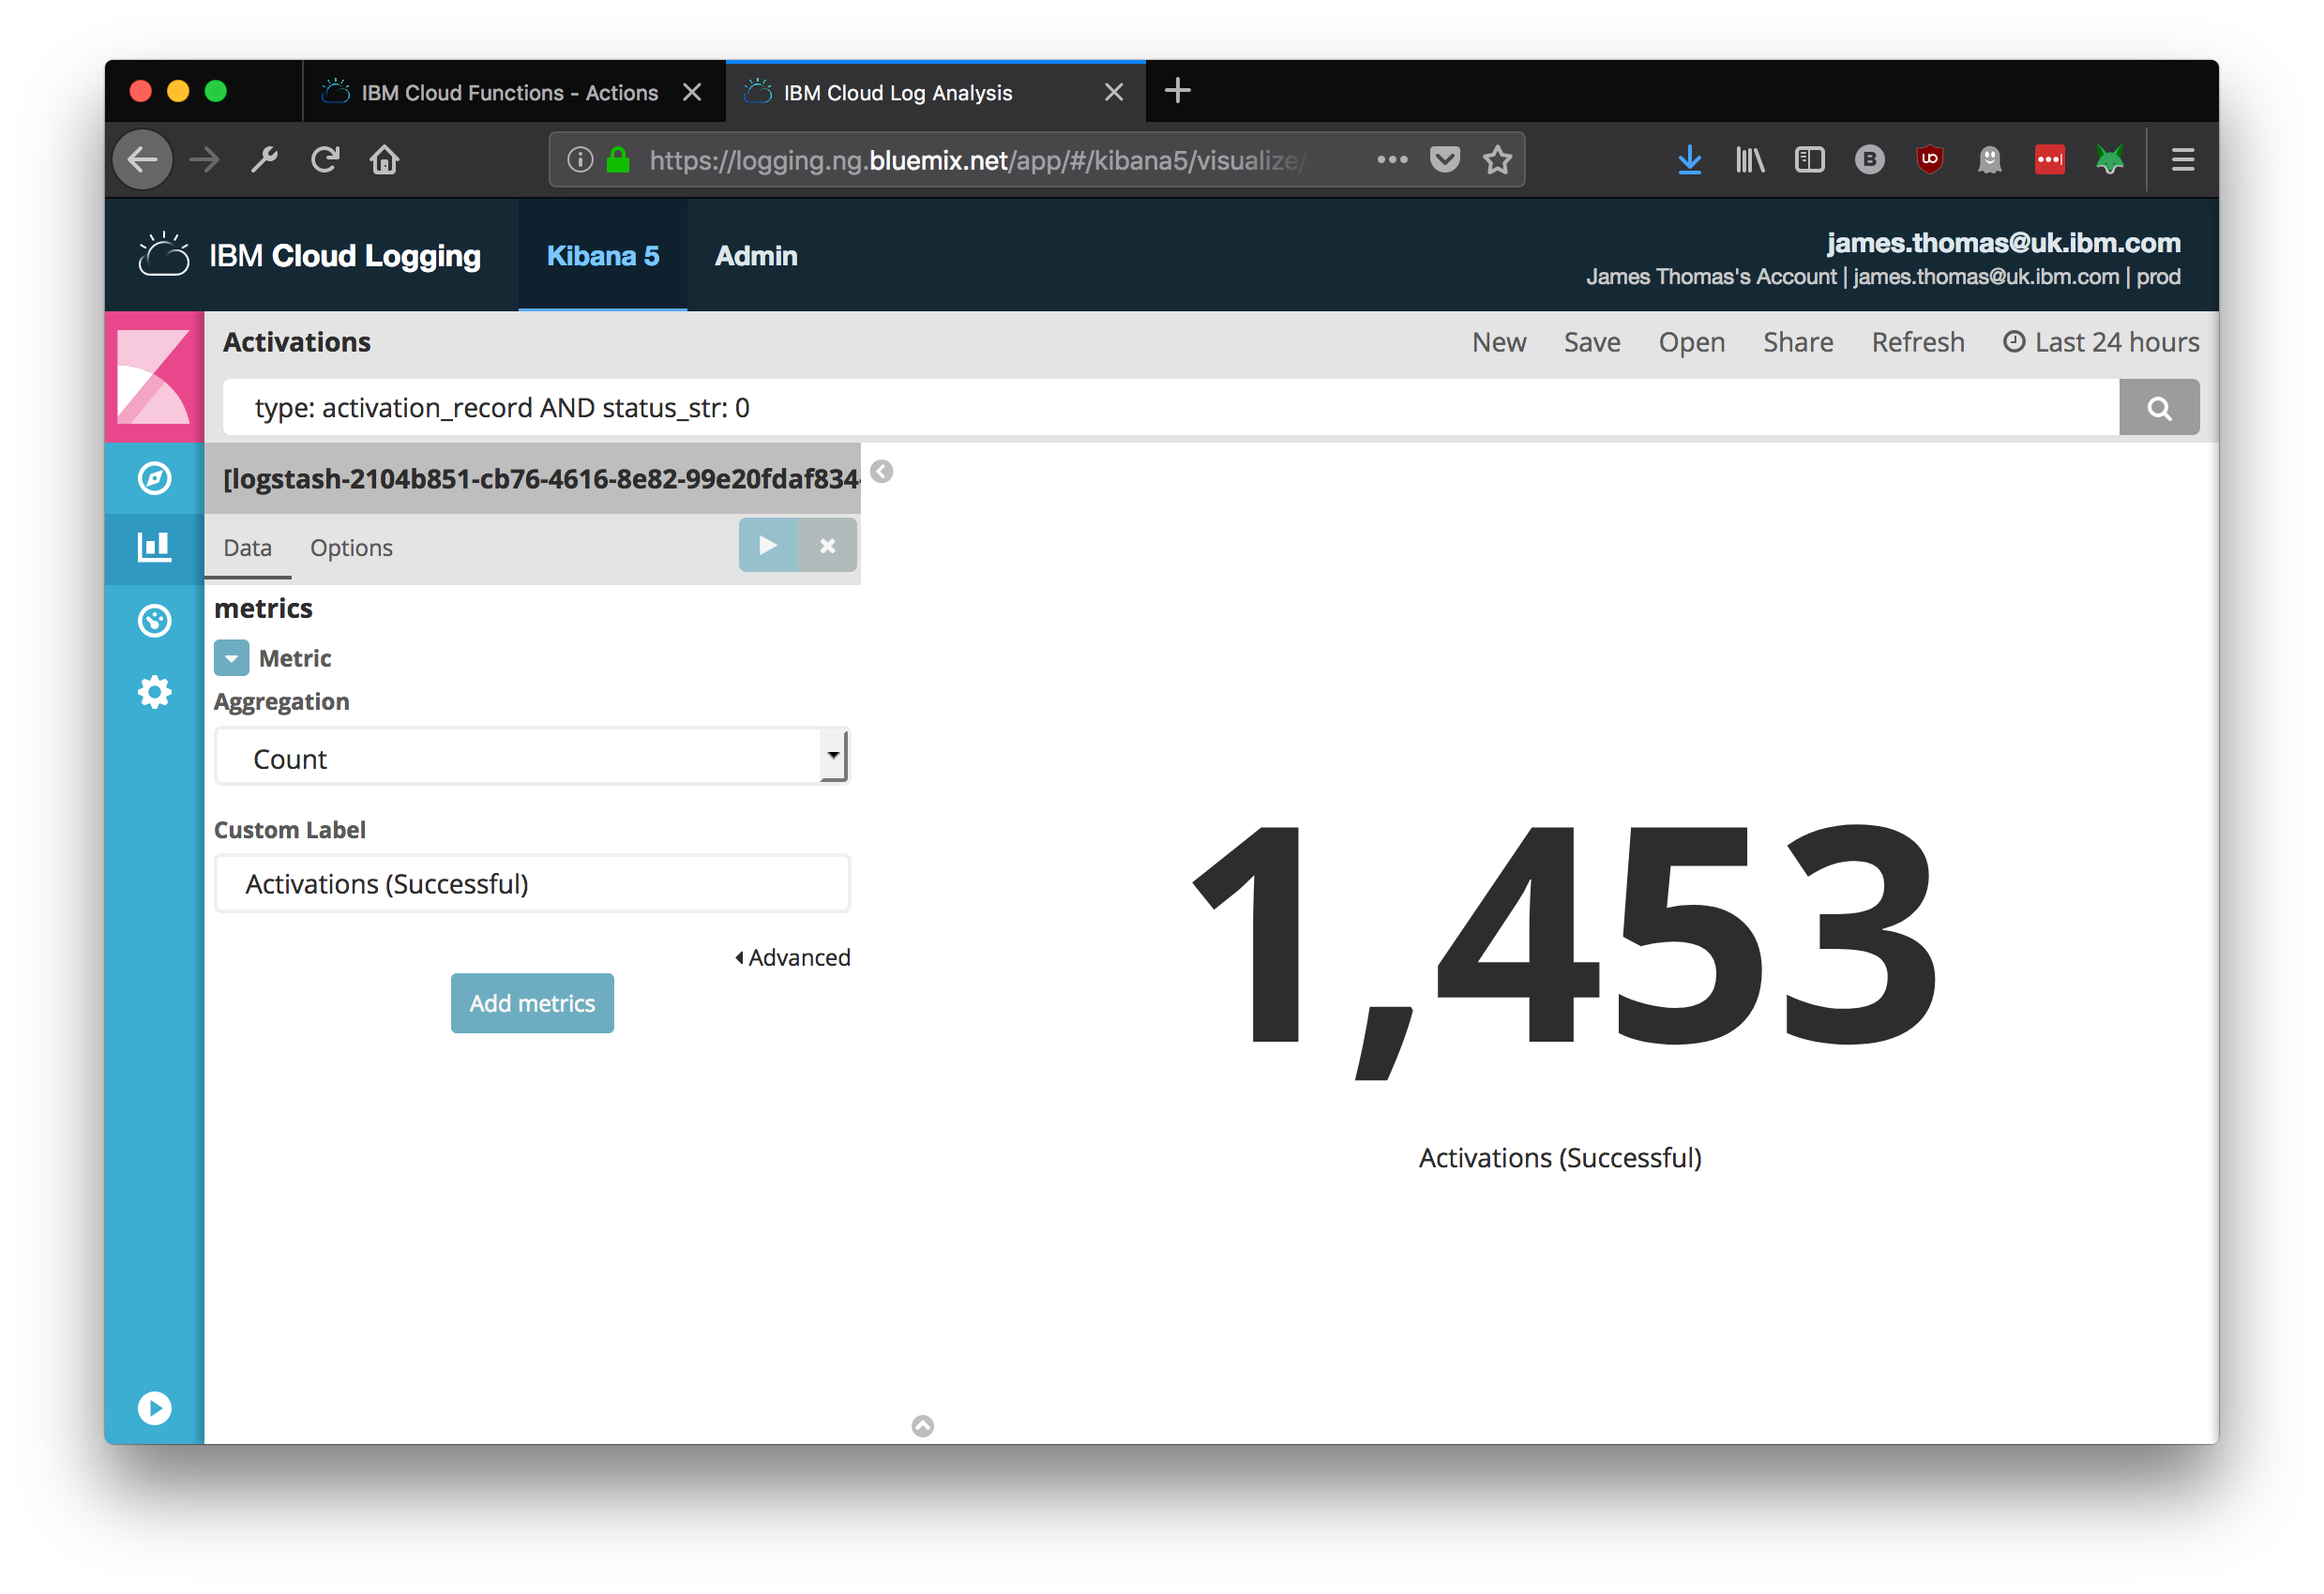
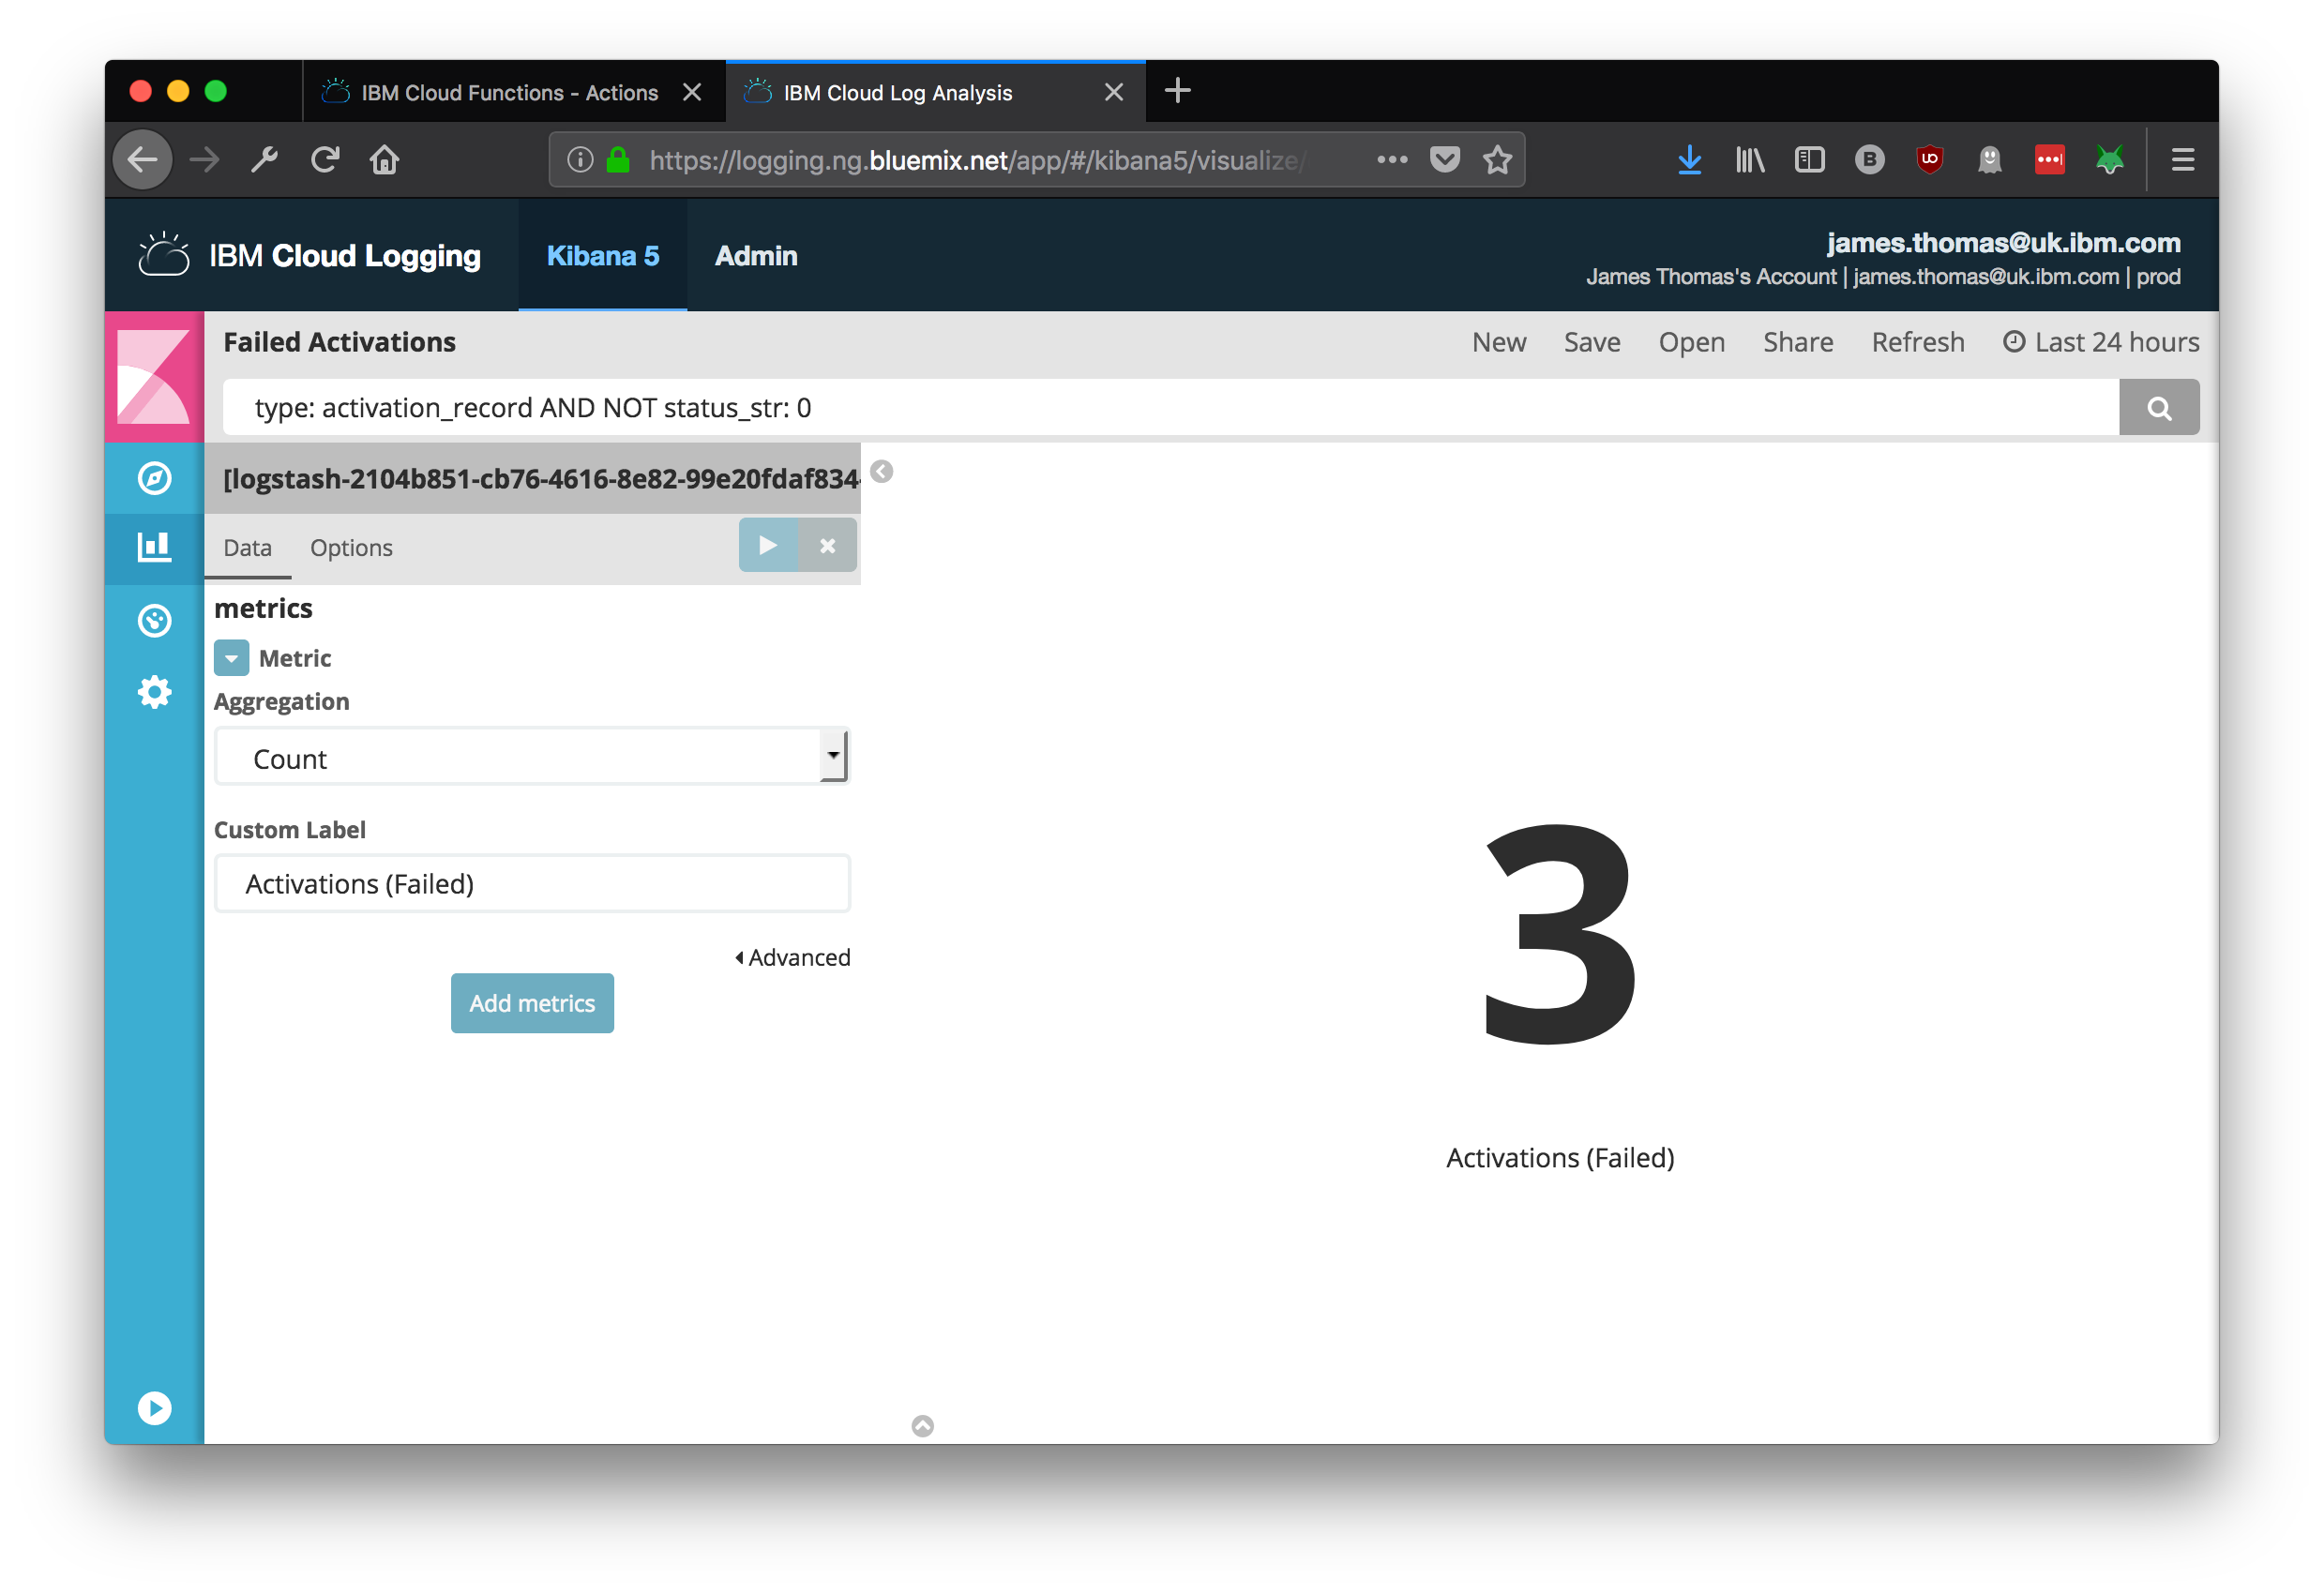
Activation Counts
Counts for successful and failed activations are displayed as singular metric values.
- Select the “Metric” visualisation from the visualisation type list.
- Use the “activation records (success)” saved search as the data source.
- Ensure the Metric Aggregation is set to “Count”
- Set the “Font Size” under the Options menu to 120pt.
- Save the visualisation as “Activation Counts (Success)”
- Repeat this process to create the failed activation count visualisation.
- Use the “activation records (failed)” saved search as the data source.
- Save the visualisation as “Activation Counts (Failed)”.
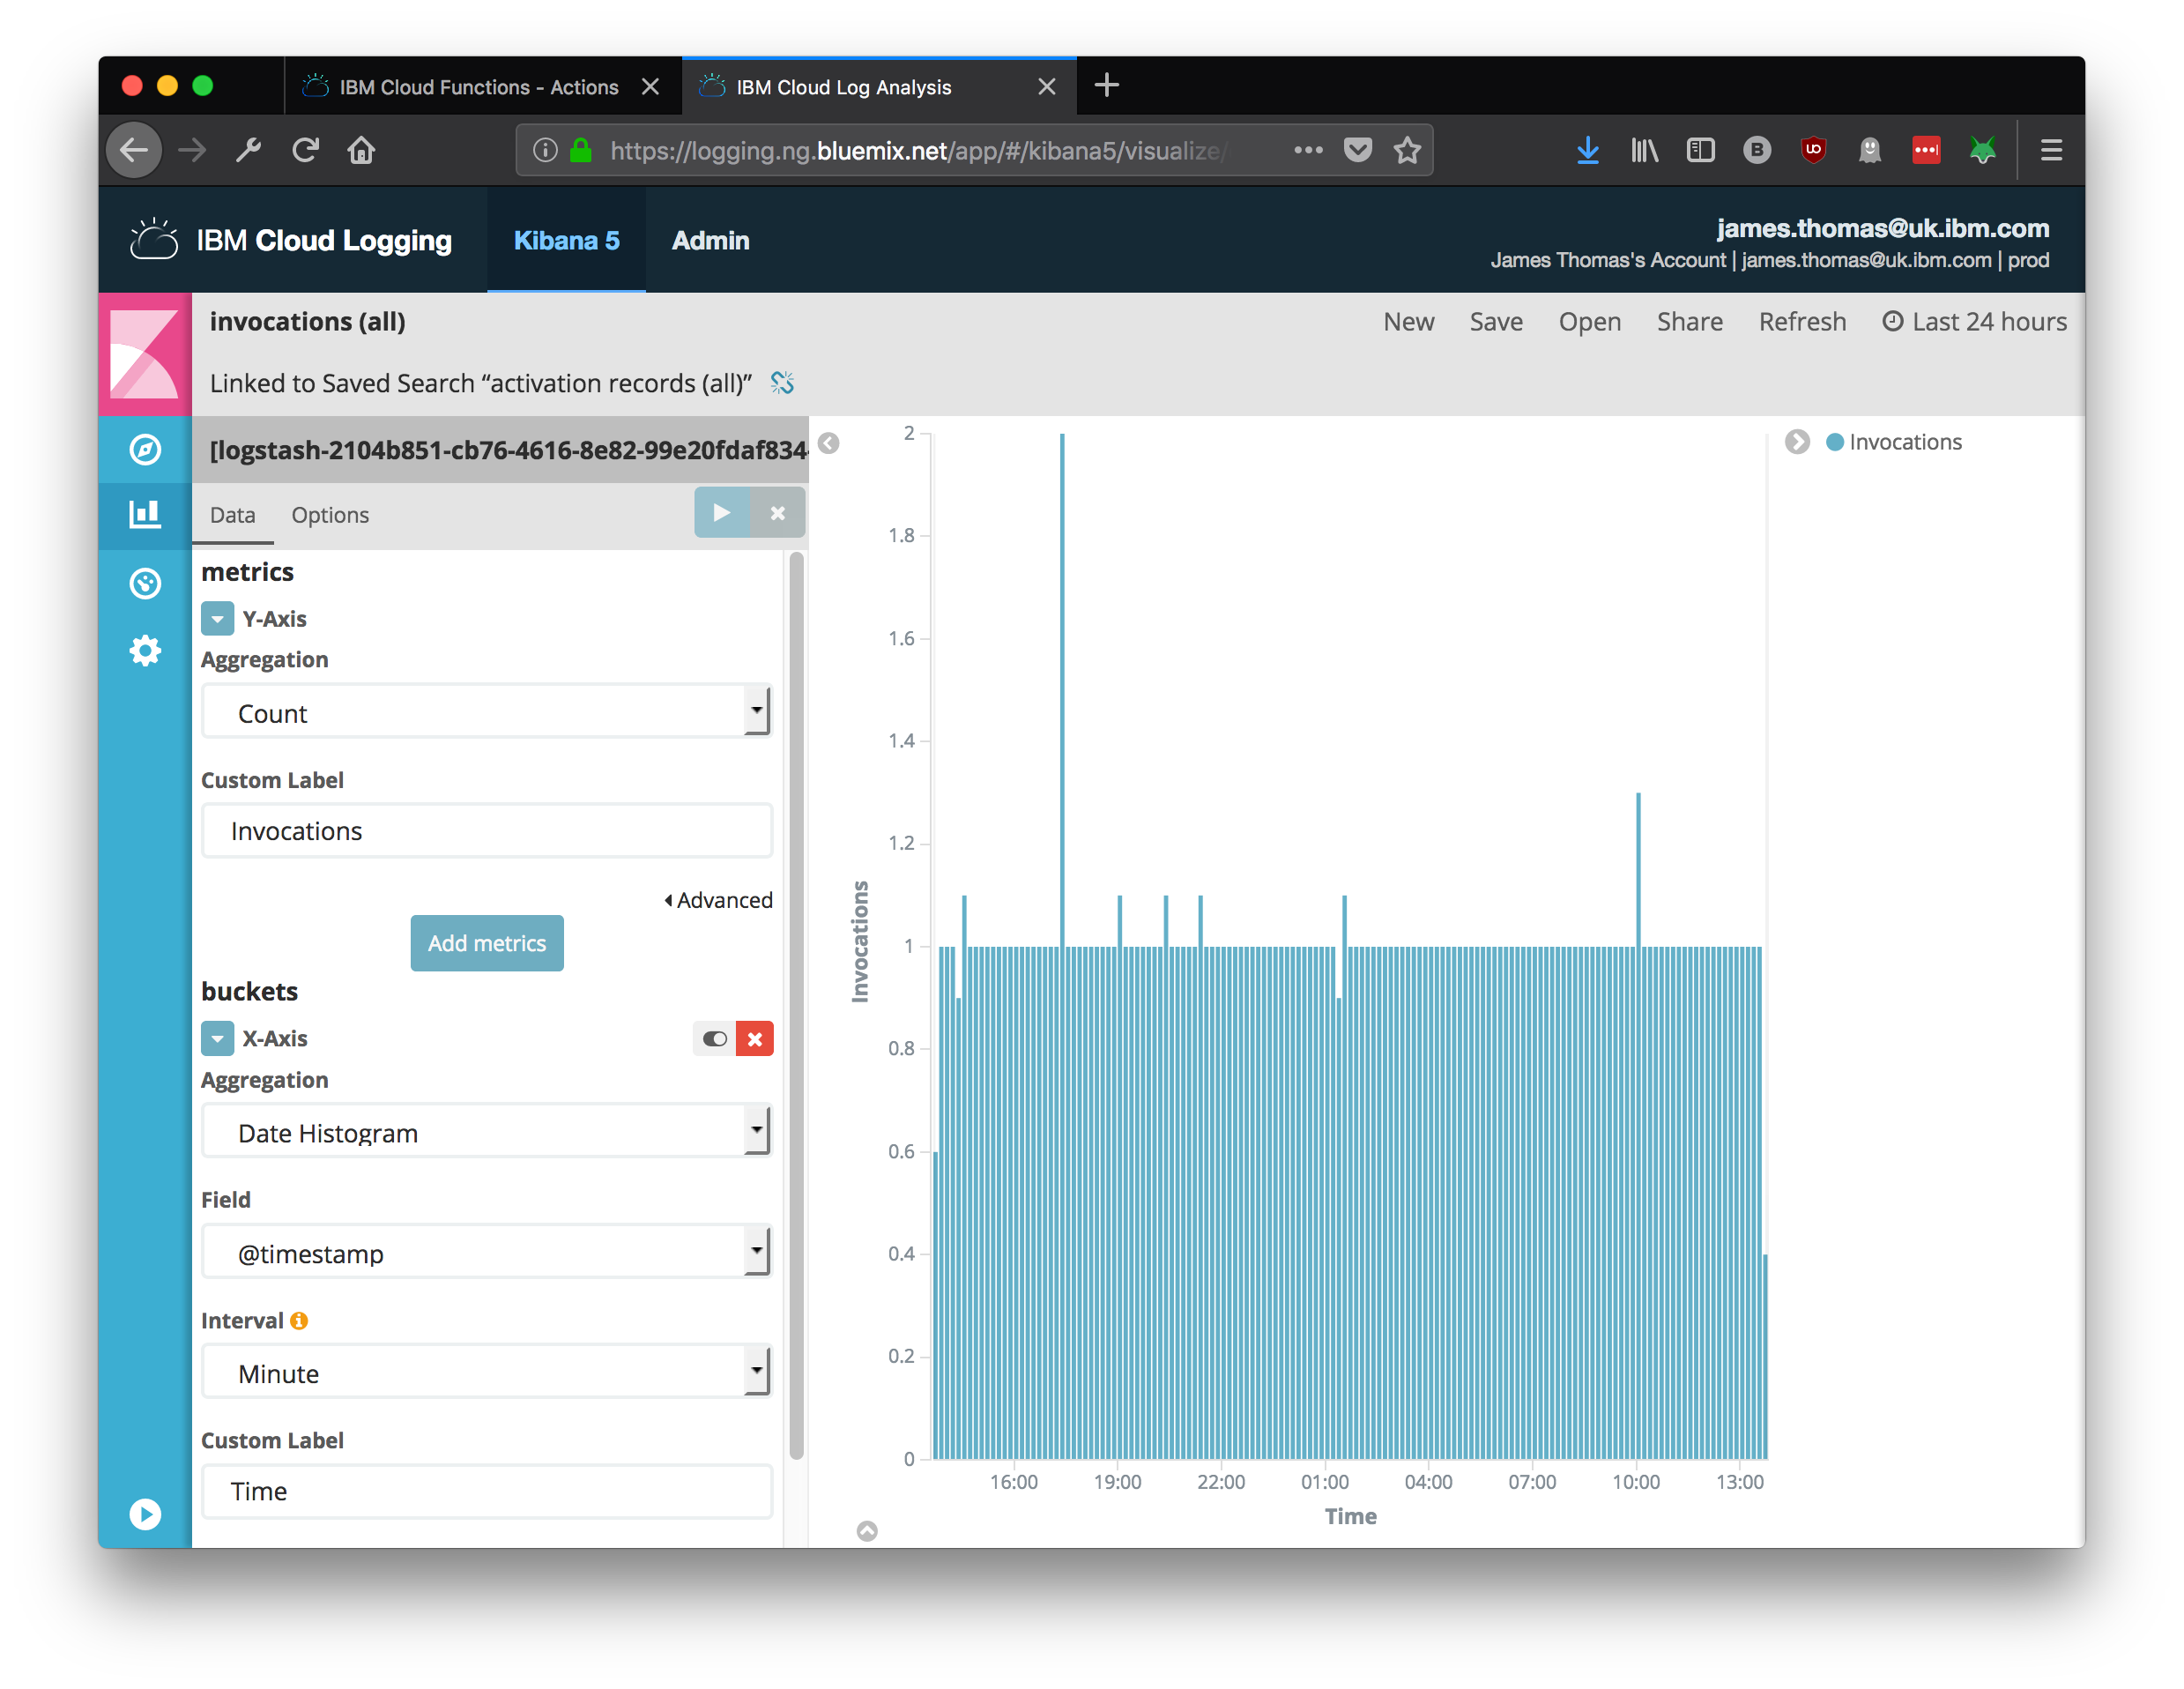
Activation Times
Activation counts over time, for successful and failed invocations, are displayed in vertical bar charts.
- Select the “Vertical bar chart” visualisation from the visualisation type list.
- Use the “activation records (success)” saved search as the data source.
- Set the “Custom Label” to Invocations
- Add an “X-Axis” bucket type under the Buckets section.
- Choose “Date Histogram” for the aggregation, “@timestamp” for the field and “Minute” for the interval.
- Save the visualisation as “Activation Times (Success)”
- Repeat this process to create the failed activation times visualisation.
- Use the “activation records (failed)” saved search as the data source.
- Save the visualisation as “Activation Times (Failed)”
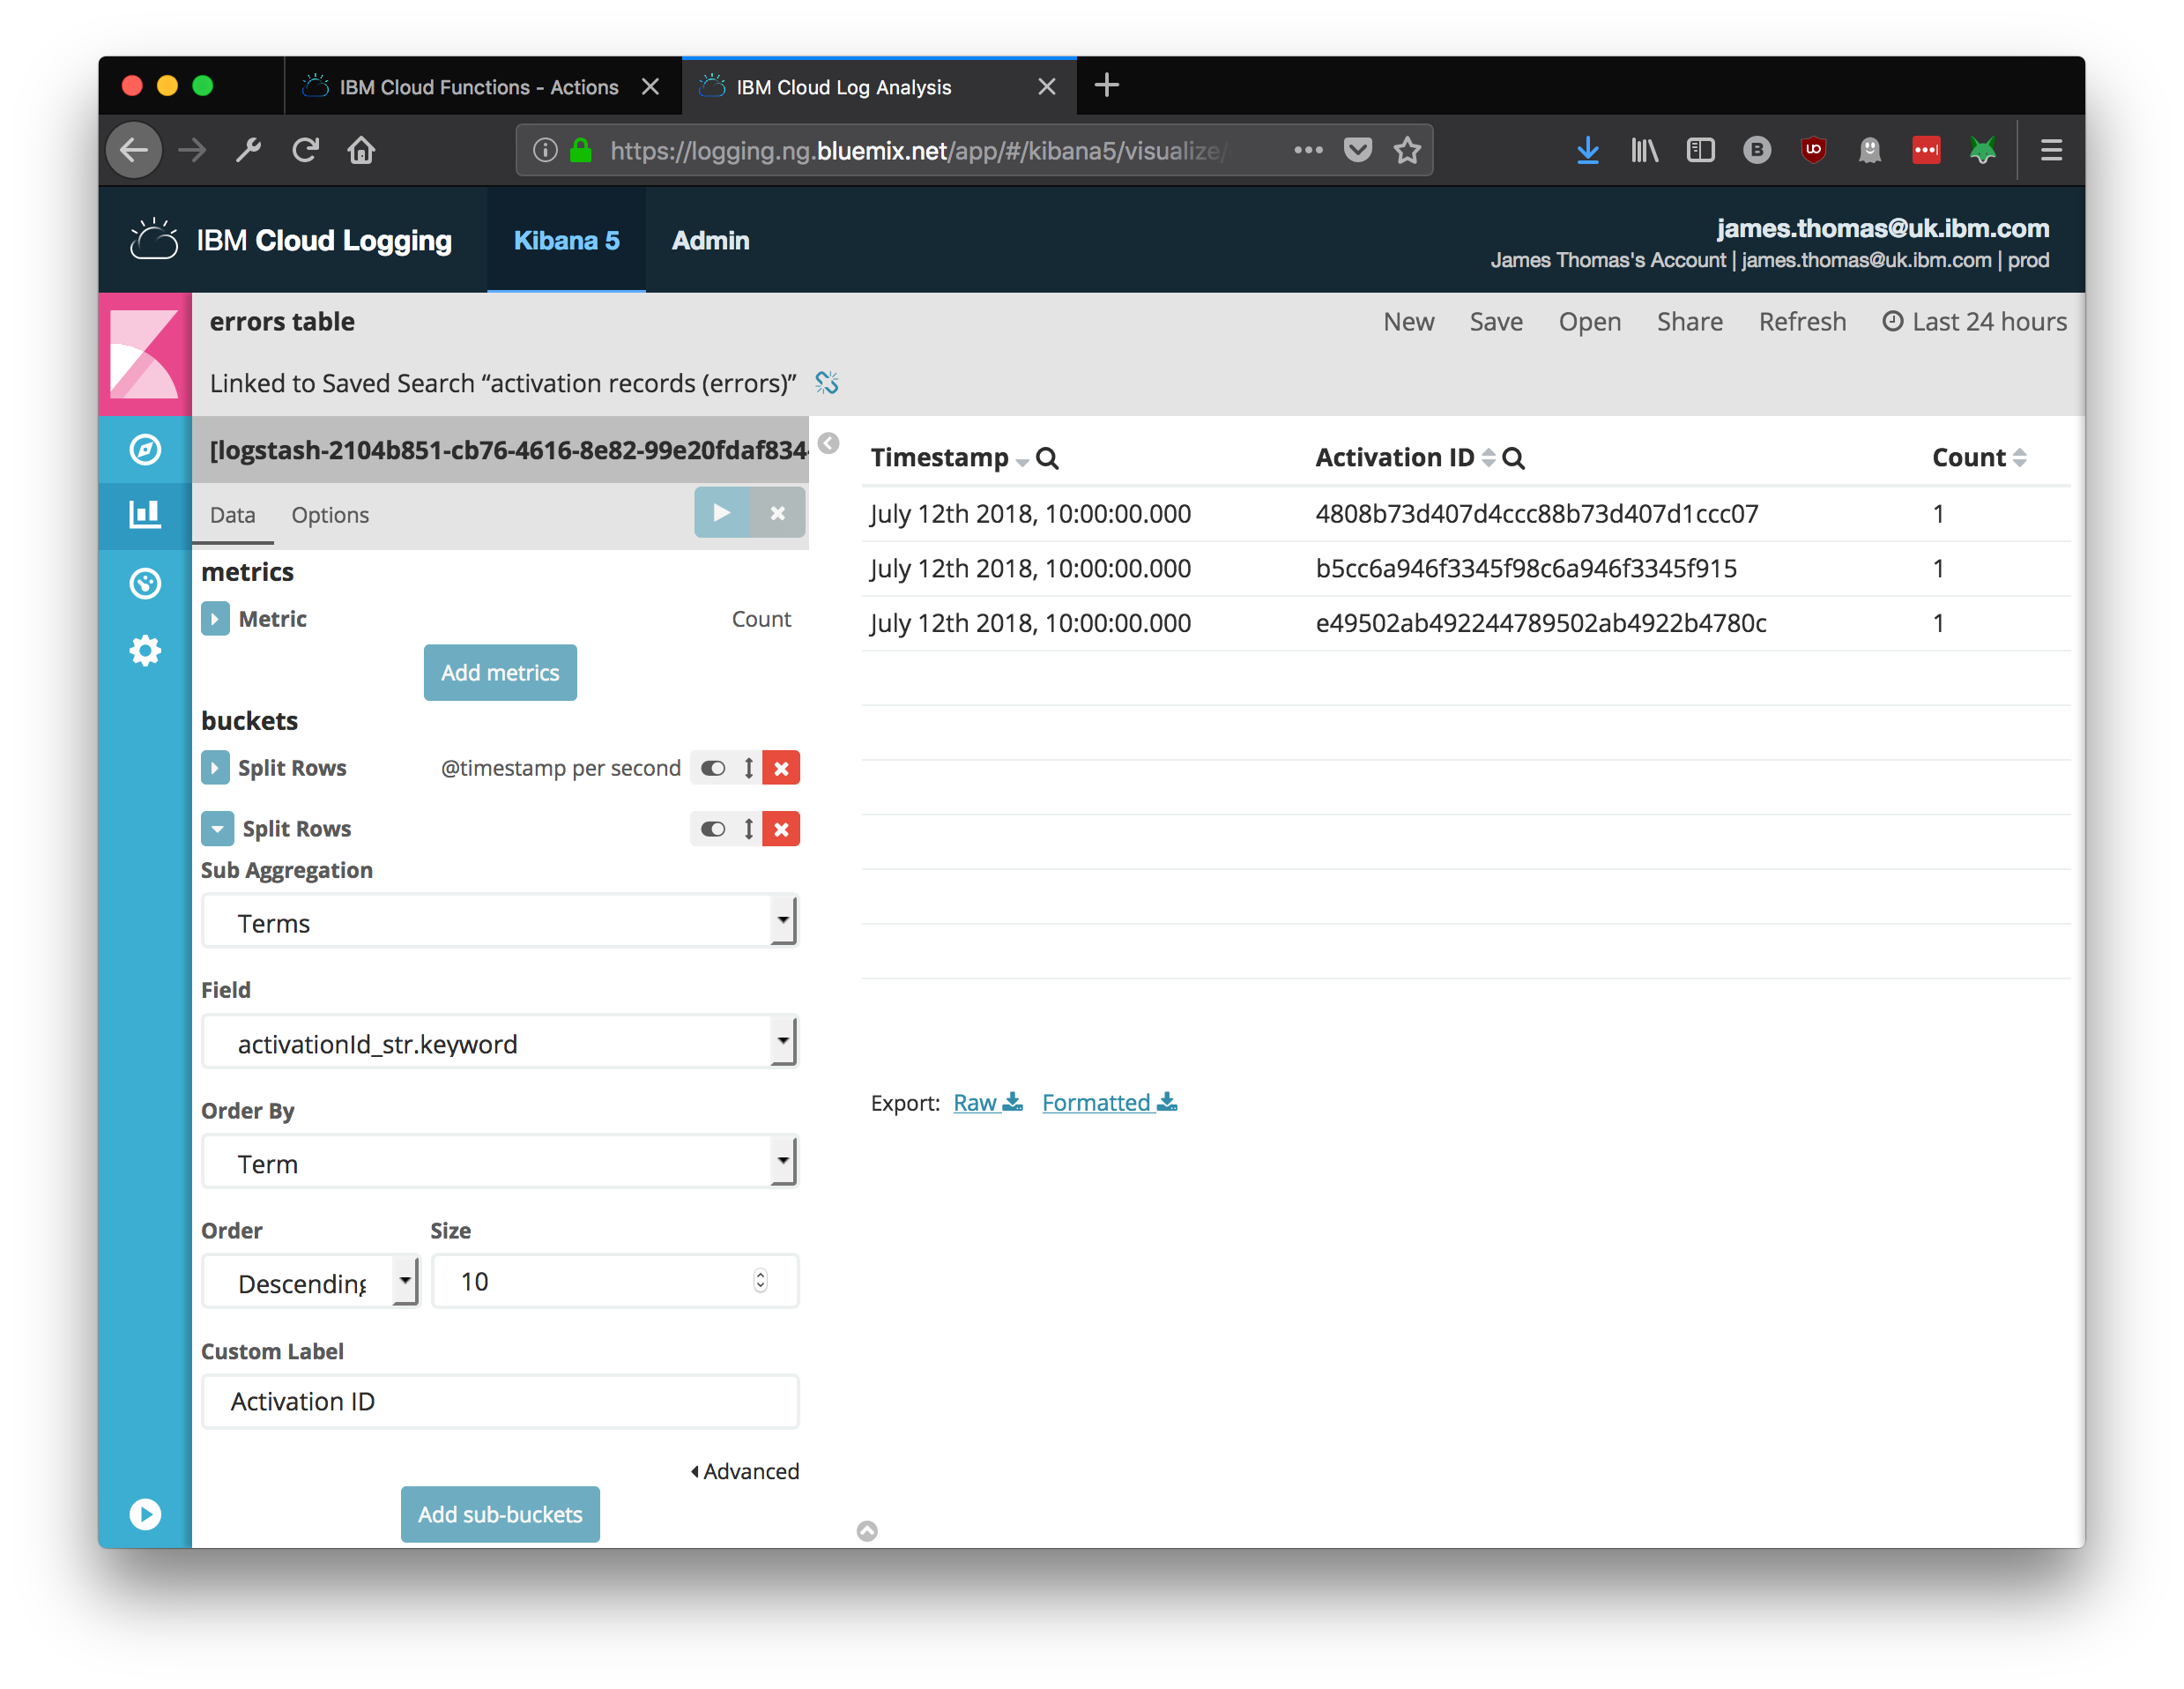
Failed Activations List
Activation identifiers for failed invocations are shown using a data table.
- Select the “Data table” visualisation from the visualisation type list.
- Use the “activation records (failed)” saved search as the data source.
- Add a “Split Rows” bucket type under the Buckets section.
- Choose “Date Histogram” for the aggregation, “@timestamp” for the field and “Second” for the interval.
- Add a “sub-bucket” with the “Split Rows” type.
- Set sub aggregation to “Terms”, field to “activationId_str” and order by “Term”.
- Save the visualisation as “Errors Table”
Creating the dashboard
Having created the individual visualisations components, the monitoring dashboard can be constructed.
- Click the “Dashboard” menu item from the left-and menu panel.
- Click the “Add” button to import visualisations into the current dashboard.
- Add each of the five visualisations created above.
Hovering the mouse cursor over visualisations will reveal icons for moving and re-sizing.
- Re-order the visualisations into the following rows:
- Activations Metrics
- Activation Times
- Failed Activations List
- Select the “Last 24 hours” time window, available from the relative time ranges menu.
- Save the dashboard as “Cloud Functions Monitoring”. Tick the “store time with dashboard” option.
Having saved the dashboard with time window, re-opening the dashboard will show our visualisations with data for the previous 24 hours. This dashboard can be used to quickly review recent application issues.
Conclusion
Monitoring serverless applications is crucial to diagnosing issues on serverless platforms.
IBM Cloud Functions provides automatic integration with the IBM Cloud Logging service. All activation records and application logs from serverless applications are automatically forwarded as log records. This makes it simple to build custom monitoring dashboards using these records for serverless applications running on IBM Cloud Functions.
Using this service with World Cup Twitter bot allowed me to easily monitor the application for issues. This was much easier than manually retrieving and reviewing activation records using the CLI!