James Thomas

Notes on software.

Running One-off Tasks in Cloud Foundry

Whether making changes to a database schema, bulk importing data to initialise a database or setting up a connected service, there are often administrative tasks that needed to be carried out for an application to run correctly.

These tasks usually need finishing before starting the application and should not be executed more than once.

Previously, the CF CLI provided commands, tunnel and console, to help running one-off tasks manually. These commands were deprecated with the upgrade from v5 to v6 to discourage snowflake environments.

It is still possible, with a bit of hacking, to run one-off tasks manually from the application container.

A better way is to describe tasks as code and run them automatically during normal deployments. This results in applications that can be recreated without manual intervention.

We’ll look at both options before introducing a new library, oneoff, that automates running administration tasks for Node.js applications.

Running Tasks Manually

Local Environment

Rather than running administrative tasks from the application console, we can run them from a local development environment by remotely connecting to the bound services.

This will be dependent on the provisioned services allowing remote access. Many “built-in” platform services, e.g. MySQL, Redis, do not allow this.

Third-party services generally do.

Using the cf env command we can list service credentials for an application. These authentication details can often be used locally by connecting through a client library running in a local development environment.

For example, to access a provisioned Cloudant instance locally, we can grab the credentials and use with a Node.js client library.

1
2
3
4
5
6
7
8
9
10
11
12
13
14
15
16
17
18
19
20
21
22
23
24
25
26
27
28
29
30
31
32
33
[15:48:22 ~/code/sample]$ cf env sample-demo-app
Getting env variables for app sample-demo-app in org james.thomas@uk.ibm.com / space dev as james.thomas@uk.ibm.com...
OK

System-Provided:
{
 "VCAP_SERVICES": {
  "cloudantNoSQLDB": [
   {
    "credentials": {
     "host": "1234-bluemix.cloudant.com",
     "password": "sample_password",
     "port": 443,
     "url": "https://1234-bluemix:sample_password@1234-bluemix.cloudant.com",
     "username": "1234-bluemix"
    }
....

[15:48:22 ~/code/sample]$ cat connect.js
var Cloudant = require('cloudant');

var me = '1234-bluemix';
var password = 'sample_password';

// Initialize the library with my account.
var cloudant = Cloudant({account:me, password:password});

cloudant.db.list(function(err, allDbs) {
  console.log('All my databases: %s', allDbs.join(', '))
  // Run administrative tasks
});
[15:48:22 ~/code/sample]$ node connect.js
All my databases: example_db, jasons_stuff, scores

Remote Environment

When provisioned services don’t allow external access, the cf-ssh project creates SSH access to application containers running within Cloud Foundry.

How does this work?!

cf-ssh deploys a new Cloud Foundry application, containing the same bits as your target application, with the same bound services.
This new application’s container does not start your web application as per normal. Instead, it starts an outbound reverse SSH tunnel to a public proxy.
The local cf-ssh client then launches an interactive ssh connect to the public proxy, which tunnels through to the application container.

See the explanation here for full details.

This approach will let you connect to services from within the Cloud Foundry platform environment.

This video from Stark & Wayne’s Dr. Nic shows the command in action…

IBM Bluemix Console (Java and Node.js)

This technique is only for the IBM Bluemix platform.

If you are deploying Node.js and Java applications on IBM Bluemix, the platform provides the following tools to assist with application management.

  • proxy: Minimal application management that serves as a proxy between your application and Bluemix.
  • devconsole: Enables the development console utility.
  • shell: Enables a web-based shell.
  • trace: (Node.js only) Dynamically set trace levels if your application is using log4js, ibmbluemix, or bunyan logging modules.
  • inspector: (Node.js only) Enables node inspector debugger.
  • debug: (Liberty only) Enables clients to establish a remote debugging session with the application.
  • jmx: (Liberty only) Enables the JMX REST Connector to allow connections from remote JMX clients

The tools are enabled by setting the environment variable (BLUEMIX_APP_MGMT_ENABLE) with the desired utilities.

1
$ cf set-env myApp BLUEMIX_APP_MGMT_ENABLE devconsole+shell+trace

Applications must be restarted for the changes to take effect.

If we enable the shell utility, the following web-based console will be available at https://your-app-name.mybluemix.net/bluemix-debug/shell.

Cloud Foundry Diego Runtime

Diego is the next-generation runtime that will power upcoming versions of Cloud Foundry. Diego will provide many benefits over the existing runtime, e.g. Docker support, including enabling SSH access to containers without the workarounds needed above.

Yay!

Follow the instructions here for details on SSH access to applications running on the new runtime.

Access to this feature will be dependent on your Cloud Foundry provider migrating to the new runtime.

Running Tasks Automatically

Manually running one-off administrative tasks for Cloud Foundry applications is a bad idea.

It affects your ability to do continuous delivery and encourages snowflake environments.

Alternatively, defining tasks as code means they can run automatically during normal deployments. No more manual steps are required to deploy applications.

There are many different libraries for every language to help you programmatically define, manage and run tasks.

With tasks defined as code, you need to configure your application manifest to run these automatically during deployments.

Cloud Foundry uses the command parameter, set in the manifest or through the command-line, to allow applications to specify a custom start command. We can use this parameter to execute the task library command during deployment.

The Cloud Foundry documentation also details these approaches, with slightly different implementations here and specifically for Ruby developers here.

Temporary Task Deploy

For applications which only need occasional administrative tasks, it’s often easier to push a temporary deploy with a custom start command. This deploy runs your tasks without then starting your application. Once the tasks have completed, redeploy your application normally, destroying the task instance.

The following command will deploy a temporary instance for this purpose:

1
$ cf push -c 'YOUR_TASK_LIB_COMMAND && sleep infinity' -i 1 --no-route

We’re overriding the default start command, setting it to run the command for our task library, e.g. rake db:migrate.

The sleep infinity command stops the application exiting once the task runner has finished. If this happens, the platform will assume that application has crashed and restart it.

Also, the task runner will not be binding to a port so we need to use the –no-route argument to stop the platform assuming the deploy has timed out.

Setting the deploy to a single instance stops the command being executed more than once.

Checking the logs to verify the task runner has finished correctly, we can now redeploy our application. Using the null start command will force the platform to use the buildpack default rather than our previous option.

1
$ cf push -c 'null'

Running Tasks Before Startup

If we’re regularly running administrative tasks, we should incorporate the task execution into our normal application startup. Once the task command has finished successfully, we start the application as normal.

Applications may have multiple instances running, we need to ensure the tasks are only executed by one instance.

The following custom start command will execute tasks during startup, using the CF_INSTANCE_ID environment variable to enforce execution at most-once.

[ $CF_INSTANCE_INDEX -eq 0 ]] && node lib/tasks/runner.js; node app.js

With this approach, tasks will be automatically executed during regular deployments without any manual intervention.

Hurrah!

Managing tasks for Node.js applications

If you’re running Node.js applications on Cloud Foundry, oneoff is a task library that helps you define tasks as code and integrates with the Cloud Foundry runtime. The module handles all the complexities with automating tasks during deployments across multi-instance applications.

oneoff provides the following features…

* ensure tasks are completed before application startup
* coordinating app instances to ensure at-most once task execution
* automagically discovering tasks from the task directory
* dependency ordering, ensure task a completes before task b starts
* parallel task execution
* ignore completed tasks in future deployments

Check it out to help make writing tasks as code for Node.js applications much easier!

Full details on usage are available in the README.

Conclusion

Running one-off tasks for application configuration is a normal part of any development project.

Carrying out these tasks manually used to be the norm, but with the devops movement we now prefer automated configuration rather manual intervention. Relying on manual configuration steps to deploy applications restricts our ability to implement continuous delivery.

Cloud Foundry is an opinionated platform, actively discouraging the creation of snowflake environments.

Whilst it is still possible to manually run administrative tasks, either by connecting to bound services locally or using a remote console, it’s preferable to describe our tasks as code and let the platform handle it.

Using custom start commands, we can deploy applications which run tasks automatically during their normal startup procedure.
GeoPix Live Photos

Andrew Trice wrote a great sample application for IBM Bluemix called GeoPix.

GeoPix uses the IBM MobileFirst services to provide a native iOS application which allows users to capture images from their mobile phones, storing them on the local device with automatic syncing to the cloud when online.

Using a web application, the user can view their images over a map based upon their location when the photo was taken.

I’ve been using the demonstration to highlight the mobile capabilities of IBM Bluemix and had an idea for an enhancement…

Could the web page update with new pictures without having to refresh the page?

Looking at the source code, the web application is a Node.js application using the Leaflet JavaScript library to create interactive maps. Images captured from mobile devices are synchronised to a remote CouchDB database. When the user visits the GeoPix site, the application queries this database for all mobile images and renders the HTML using the Jade templating language.

Adding support for live photos will require two new features…

  • Triggering backend events when new photos are available
  • Sending these photos in real-time to the web page

Change Notifications Using CouchDB

CouchDB comes with built-in support for listening to changes in a database, change notifications. The _changes feed for a database is an activity stream publishing all document modifications.

GeoPix uses the following CouchDB client library, to interact with our database from NodeJS. This library provides an API to start following database changes and register callbacks for updates.

Modifying our application code, upon connecting to the CouchDB database, we register a change notification handler. We follow all changes that occur in the future (since: “now”) and include the full document contents in the change event (include_docs: true).

1
2
3
4
5
6
7
8
9
10
Cloudant({account:credentials.username, password:credentials.password}, function(err, cloudant) {
    var geopix = cloudant.use(database);
    var feed = geopix.follow({include_docs: true, since: "now"});

    feed.on('change', function (change) {
      // ....we can now send this data to the web pages
    });

    feed.follow();
})

Now, every time a user sync their local photos to the cloud, the registered callback will be executed.

How do we send new photos to the web page over a real-time stream?

Real-time Web with Socket.IO

Introducing Socket.IO

Socket.IO enables real-time bidirectional event-based communication.
It works on every platform, browser or device, focusing equally on reliability and speed.

Sounds great!

By embedding this library into our application, we can open a real-time event stream between the server and client. This channel will be used by the client to listen for new images and then update the page.

The library has great documentation and provides both server and client modules. It also integrates with ExpressJS, the web framework used in GeoPix. Socket.IO can use either WebSocket or long-polling transport protocols.

Socket.IO supports running under ExpressJS with minimal configuration, here are the changes needed to start our real-time stream in GeoPix:

1
2
3
4
5
6
7
8
9
10
11
12
13
var express = require('express');
var app = express();
var server = require('http').Server(app);
var io = require('socket.io')(server);

// ...snipped out the app routes for express

io.on('connection', function (socket) {
    console.log('New Client WSS Connection.')
});

var port = (process.env.VCAP_APP_PORT || 3000);
server.listen(port);

When a document change event is fired, executing the handle we registered above, we want to send this data to all connected clients.

Using the emit call from the server-side API will do this for us.

1
2
3
feed.on('change', function (change) {
    io.sockets.emit('image', change);
});

Now we’re sending changes to the clients, we need to modify the client-side to listen for events and update the page.

Socket.IO provides a JavaScript client library that exposes a simple API for listening to events from the server-side stream. Once we’ve included the script tag pointing to the client library, we can register a callback for image events and update the DOM with the new elements.

We’re sending the full database document associated with each photo to the client. The raw image bytes are stored as an attachment.

1
2
3
4
5
6
7
8
9
10
11
12
13
var socket = io(); // TIP: io() with no args does auto-discovery
socket.on('connect', function () {
    console.log('WSS Connected');

    socket.on('image', function (image) { // TIP: you can avoid listening on `connect` and listen on events directly too!
        var attachment = Object.keys(image.doc._attachments)[0]
        var url = "/image/" + image.doc._id + "/" + attachment;
        add_new_image(url, image.doc.clientDate, 'latitude: '
            + image.doc.latitude + ', longitude: '
            + image.doc.longitude + ', altitude: '
            + image.doc.altitude);
    });
});

…and that’s it! Now our web pages will automatically update with new photos whenever the mobile application syncs with the cloud.

CouchDB + Socket.IO = Real-time Awesome!

Adding real-time photos to our application was amazingly simple by combining CouchDB with Socket.IO.

CouchDB’s _changes API provided an easy way to follow all modifications to database documents in real-time. Socket.IO made the configuration and management of real-time event streams between our server and client straightforward.

With minimal code changes, we simply connected these two technologies to create a real-time photo stream for our GeoPix application. Awesome.

AlchemyAPI & Updated Watson Nodes for Node-RED

I’ve recently been working on a number of updates to the Node-RED nodes for the IBM Bluemix platform…

Highlights below:

New AlchemyAPI Nodes

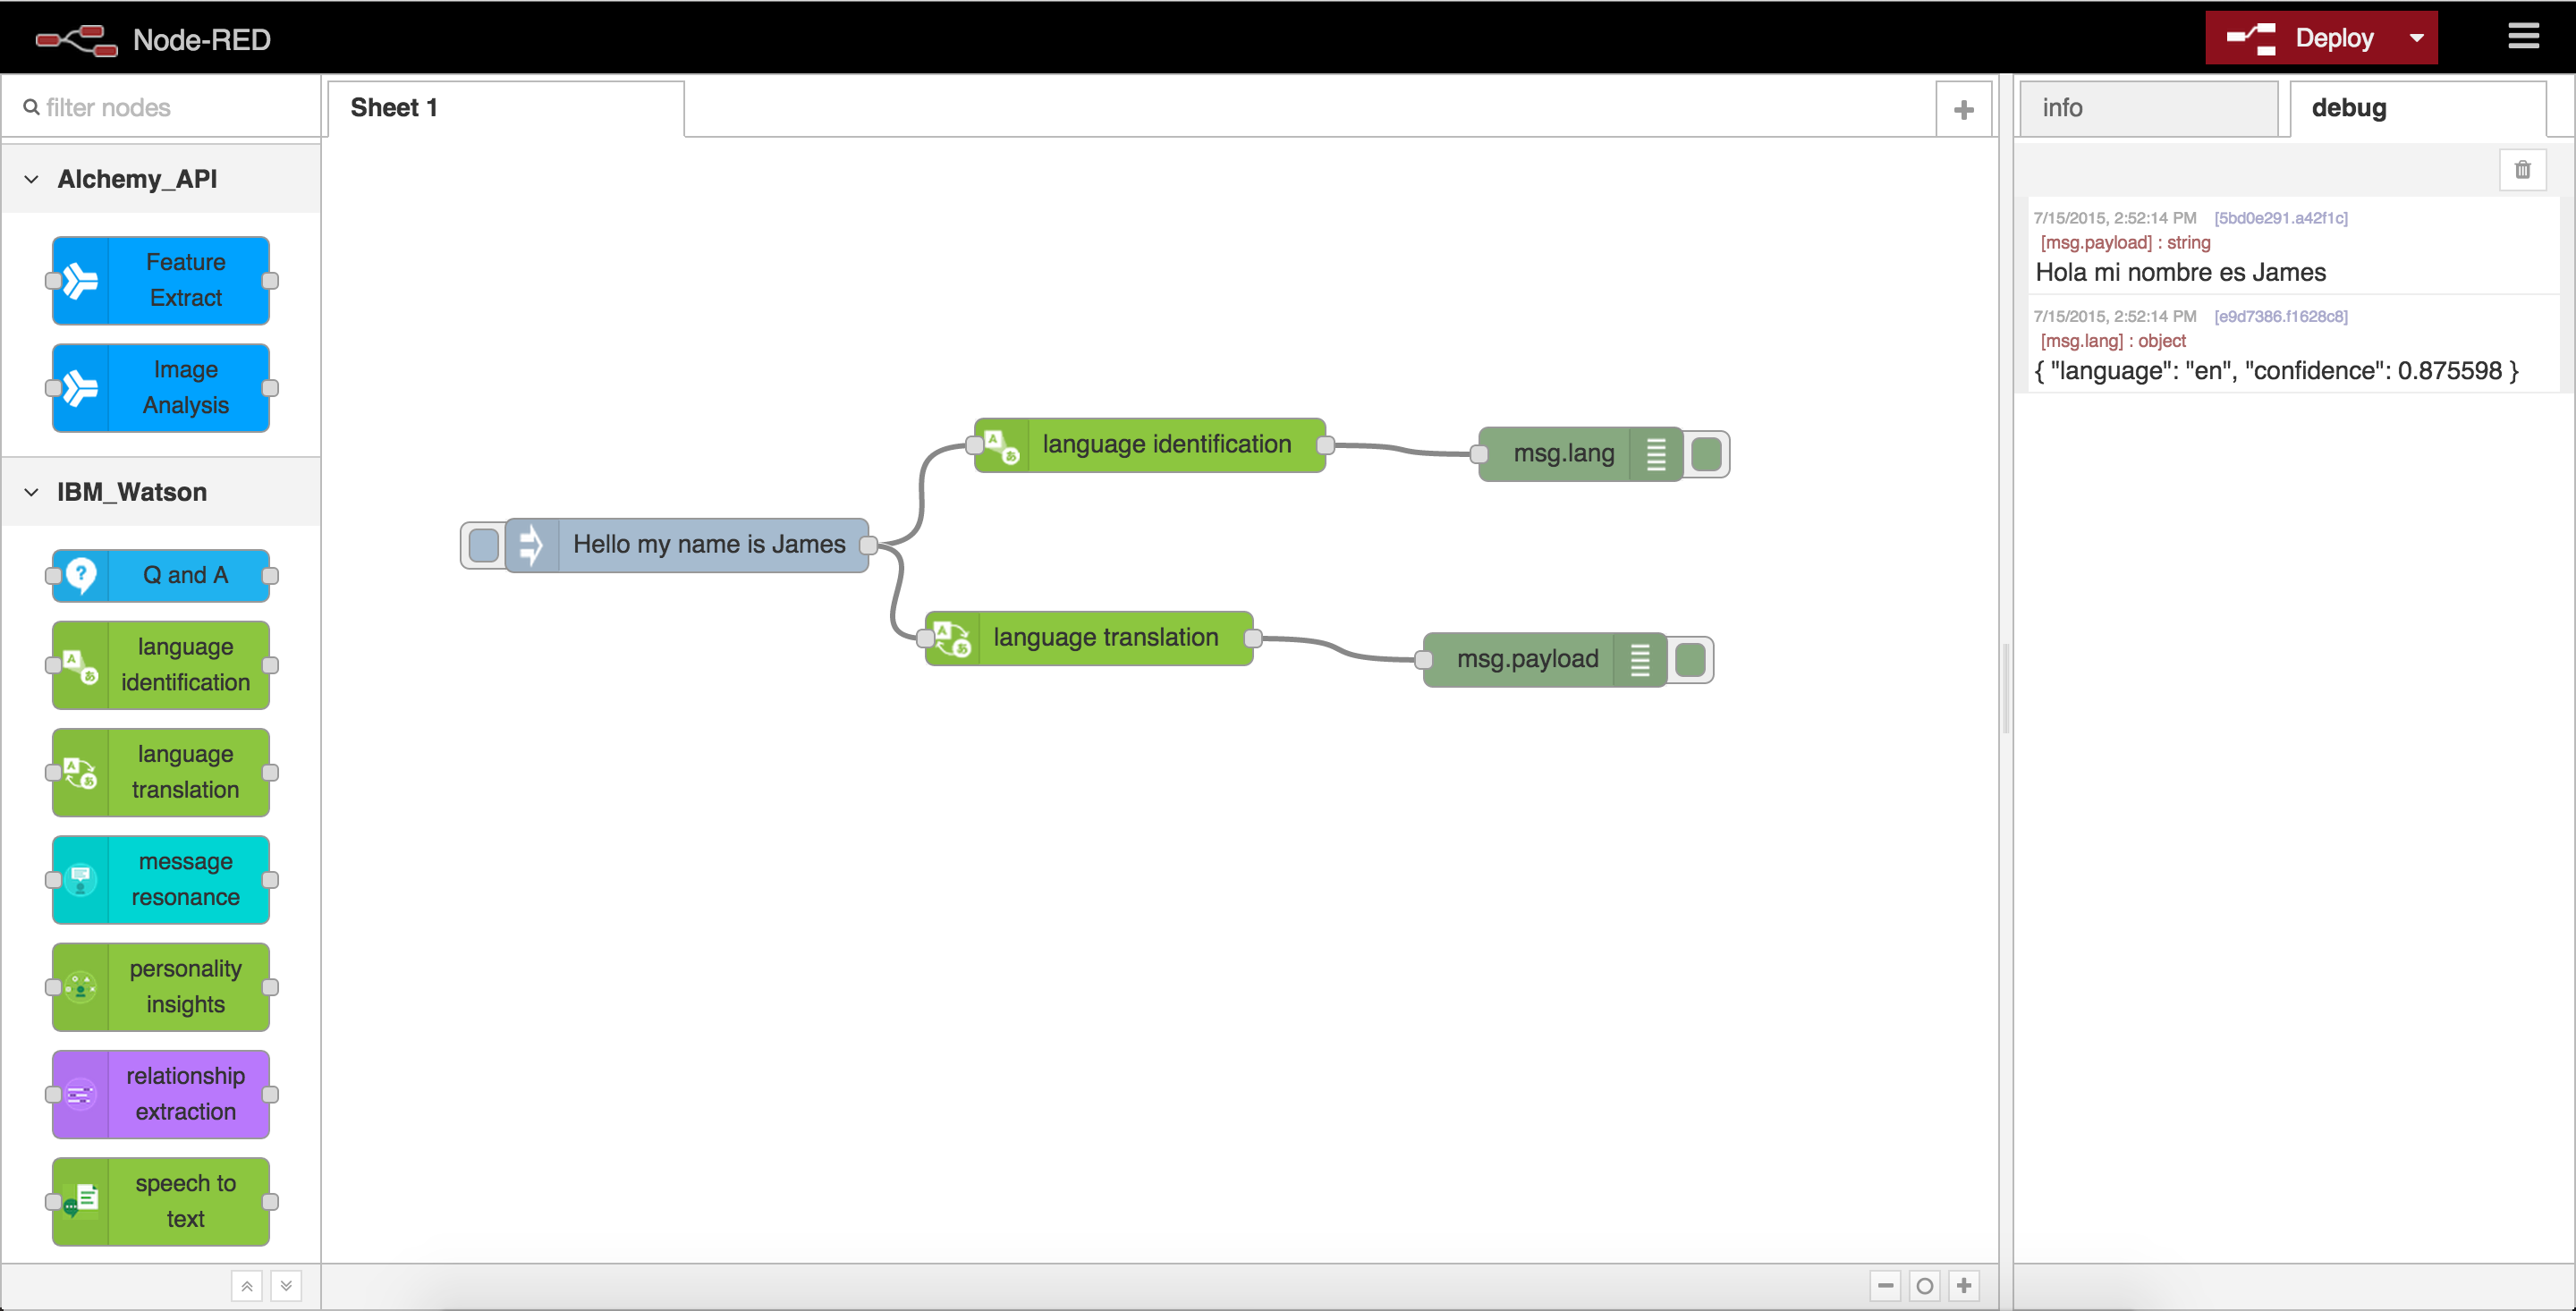
There are two new nodes (Feature Extract and Image Extract) in the package, allowing users to call services from the AlchemyAPI platform.

  • Feature Extract. This node will analyse external URLs, HTML or text content with features for text-based analysis from the AlchemyAPI service, e.g. keywords, sentiment, relationships, etc.

  • Image Analysis. This node will analyse images, passed in as external URLs or raw image bytes, to extract faces, content and URLs.

Configuration for each node is available through the node editor panel.

For full details on all the capabilities of the AlchemyAPI platform, please see their documentation.

Updated IBM Watson Nodes

With the recent changes to the IBM Watson services, there were a number of changes needed to support the API changes. All the IBM Watson nodes now work with the GA versions of the services.

Users must ensure they are using GA versions of the service with the nodes. Details on migration steps are available on the IBM Watson blog post about the updates.

Running Locally

When running Node-RED on IBM Bluemix, credentials for the services bound to the application are automatically registered. Previously, running the nodes outside of IBM Bluemix required complex configuration to register service credentials. With this release, users will be prompted to input the service credentials in the node editor panel if the application isn’t running on IBM Bluemix. Much easier!

If you have questions or encounter issues, please ask over on Stackoverflow or raise issues in Github

Debugging Cloud Foundry Stack Issues

Recent changes to the Cloud Foundry stacks supported by IBM Bluemix have led to a number of issues for users. I’ve helped users diagnose and fix issues that have occurred due to a mistmatches between the platform stack, applications and the buildpack. Learning a number of techniques for helping to discover and resolve these issues and I wanted to share them with everyone else.

Running on Cloud Foundry’s Platform-as-a-Service solution, we take for granted that low-level concepts like operating systems are abstracted away from the developer.

However, when we run into issues it can be necessary to jump into the weeds and find out what’s going on under the hood…

What are Cloud Foundry “stacks”?

According to the documentation

A stack is a prebuilt root filesystem (rootfs) which works in tandem with a buildpack and is used to support running applications.

Think of the stack as the underlying operating-system running your application. This will be combined with the buildpack to instantiate the runtime environment.

Most users don’t have to care which stack they are running on.

However, if your application needs a specific version of a system library or you want to verify a specific command line application is installed, you may need to dig deeper…

What “stacks” does my platform support?

Using the Cloud Foundry CLI, issue the following command to see what stacks are available on the platform.

1
2
3
4
5
6
7
8
[16:27:30 ~]$ cf stacks
Getting stacks in org james.thomas@uk.ibm.com / space dev as james.thomas@uk.ibm.com...
OK

name         description
lucid64      Ubuntu 10.04
seDEA        private
cflinuxfs2   Ubuntu 14.04.2 trusty

Stack information contains the unique name for each stack and the underlying operating system version.

Which “stack” is my application running on?

Since v6.11.0, the stack for an application has been shown in the CLI application info output.

1
2
3
4
5
6
7
8
9
10
11
12
13
14
[16:34:39 ~]$ cf app debug-testing
Showing health and status for app debug-testing in org james.thomas@uk.ibm.com / space dev as james.thomas@uk.ibm.com...
OK

requested state: started
instances: 1/1
usage: 512M x 1 instances
urls: debug-testing.mybluemix.net
last uploaded: Tue Jun 16 15:47:21 UTC 2015
stack: lucid64
buildpack: SDK for Node.js(TM)

     state     since                    cpu    memory           disk           details
#0   running   2015-06-30 08:53:57 PM   0.0%   242.5M of 512M   196.8M of 1G

How can I choose the “stack” my application runs on?

Users can set the stack for an application using the -s command-line parameter during deployment. The stack identifier should match one of the names shown in the output from the cf stacks command.

1
$ cf push -s stack_identifier

How are the “stacks” defined?

This Github repository contains the source files for building the stacks. There’s a Dockerfile for the current cflinuxfs2 stack to build the image used in Cloud Foundry.

How can I poke around inside a “stack” locally?

Using Docker, we can easily pull down the same “base” operating system used for a specifc “stack” and run locally.

For the cflinuxfs2 stack, we can pull down the Ubuntu Trusty image and run a terminal inside it.

1
2
$ docker pull ubuntu:trusty
$ docker run -i -t ubuntu:trusty /bin/bash

How can I easily migrate existing applications to a new stack?

Rather than having to re-deploy each application separately, there’s a great CF CLI plugin to automatically migrate all your applications from lucid64 to cflinuxfs2.

Making Logs Awesome - Elasticsearch in the Cloud Using Docker

Logs are boring.

It used to be the only time you’d be looking at your application logs was when something went wrong.

Logs filled up disk space until they rotated out of existence.

…but now businesses are increasingly focused on using data to drive decisions.

Which advert leads to the highest click-through rates?

How did that last website change affect user retention?

What customer devices should our website support?

Guess where the answers lie?

Logs.

Storing, processing and querying logs effectively is helping businesses succeed.

Introducing the ELK (Elasticsearch, Logstash, Kibana) stack…

Five years ago, Elasticsearch, an open-source full-text search engine, was released. It’s now the second most popular enterprise search engine. Complementing this project were Logstash and Kibana. Logstash was a log processing pipeline that could normalize streaming logs into a centralised Elasticsearch cluster. Kibana was an analytics and visualisation platform for turning those logs into actionable insights.

These tools were commonly used together, now known as the ELK stack, to deliver…

“an end-to-end stack that delivers actionable insights in real time from almost any type of structured and unstructured data source.”

ELK, making logs awesome!

Manually installing and configuring Elasticsearch, Logstash and Kibana is not a trivial task.

Luckily, there is a better way…

Docker

“Docker allows you to pack, ship and run any application as a lightweight container”.

Docker images define pre-configured environments that containers are started from. Docker Hub is the public image registry, where anyone can publish, search and retrieve new images.

Rather than having to install and configure individual software packages, we can pull down one of the many existing Docker images for the ELK stack.

With one command, we can spin up an entire ELK instance on any platform with no extra configuration needed.

Magic.

IBM Containers

IBM recently announced Docker support for their Platform-as-a-Service cloud service, IBM Bluemix. Developers can now deploy and manage Docker containers on a scalable cloud platform.

IBM Containers provides the following services:

  • Private image registry
  • Elastic scaling and auto-recovery
  • Persistent storage and advanced networking configuration
  • Automated security scans
  • Integration with the IBM Bluemix cloud services.

Using this service, we can build and test a custom ELK container in our local development environment and “web-scale” it by pushing to the IBM Bluemix cloud platform.

Manging Application Logs

Once our ELK instance is running, we can then start to push application logs from other applications running on IBM Bluemix into the service. We’ll look at automatically setting up a log drain to forward all applications logs into a centralised Elasticsearch service. We can then start to drive business decisions using data rather than intuition using Kibana, the visualisation dashboard.

This blog post will explain the technical details of using Docker to create a customised ELK service that can be hosted on a scalable cloud platform.

Running ELK instances Using Docker

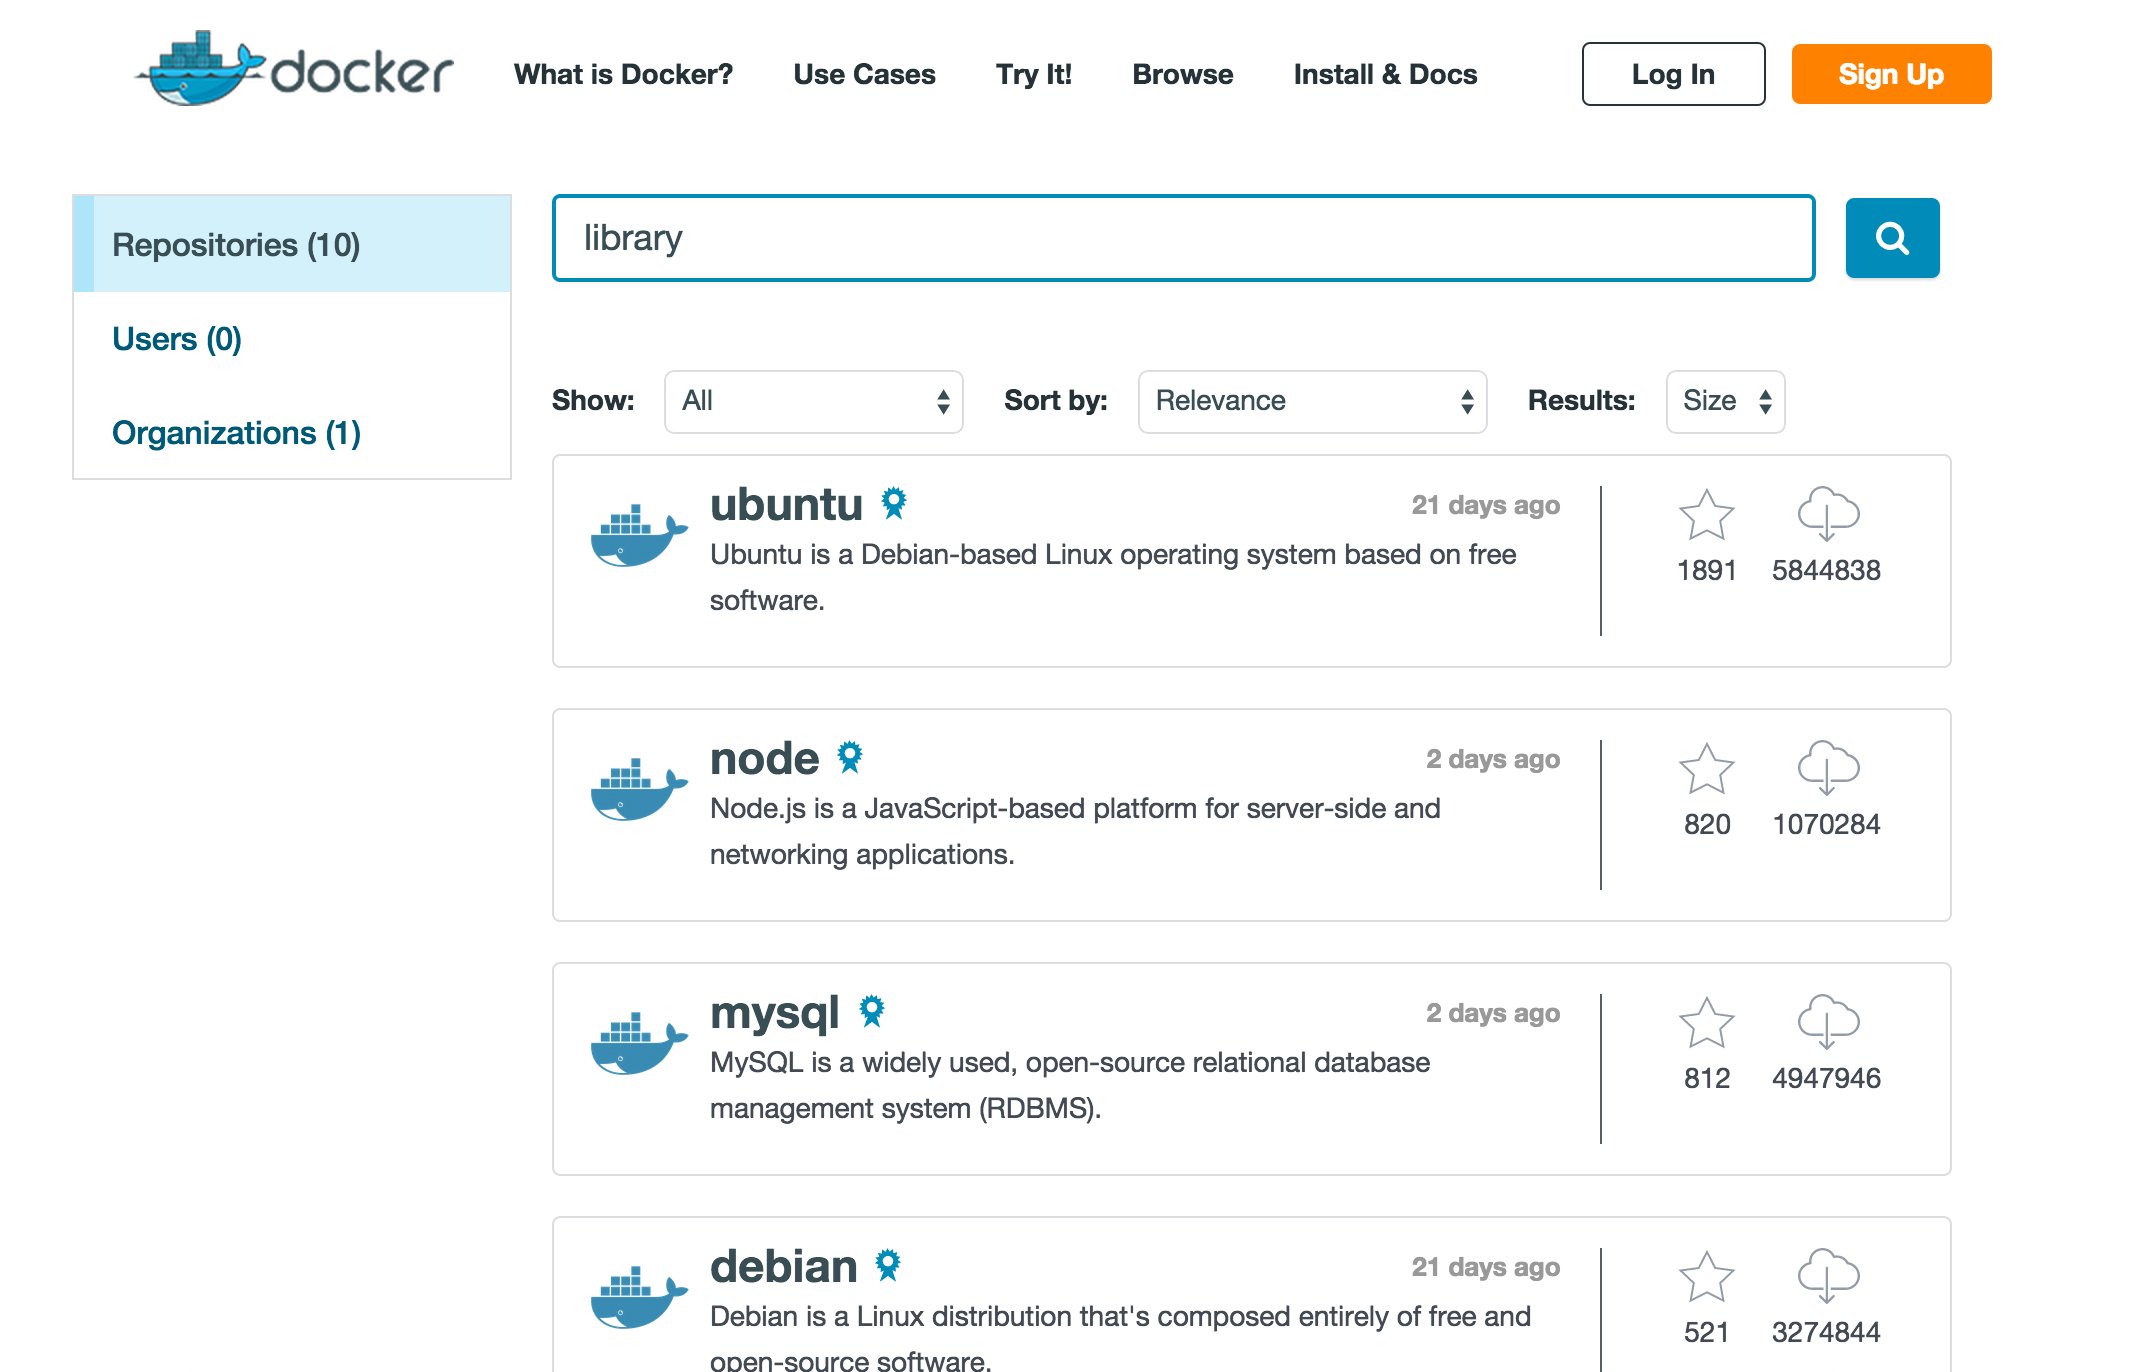
Docker Hub has over forty five thousands public images available. There are multiple public images we can pull down with a pre-configured ELK stack. Looking at the options, we’re going to use the sebp/elk repository because it’s popular and easily modifiable with a custom configuration.

We’re going to start by pulling the image into our local machine and running a container to check it’s working…

1
2
$ docker pull sebp/elk
$ docker run -p 5601:5601 -p 9200:9200 -p 5000:5000 -it --name elk sebp/elk

That last command will start a new container from the sebp/elk image, exposing the ports for Kibana (5601), Elasticsearch (9200) and Logstash (5000) for external access. The container has been started with the -i flag, interactive mode, allowing us to monitor the container logs in the console. When the instance has started, we can view the status output from command line.

1
2
3
$ docker ps
CONTAINER ID        IMAGE               COMMAND                CREATED             STATUS              PORTS                                                                              NAMES
42d40d1fb59c        sebp/elk:latest     "/usr/local/bin/star   27 seconds ago      Up 26 seconds       0.0.0.0:5000->5000/tcp, 0.0.0.0:5601->5601/tcp, 0.0.0.0:9200->9200/tcp, 9300/tcp   elk

Using Mac OS X for local development, we’re using the Boot2Docker project to host a Linux VM for deploying Docker containers locally. With the following command, we can discover the virtual IP address for the ELK container.

1
2
$ boot2docker ip
192.168.59.103

Opening a web browser, we can now visit http://192.168.59.103:5601 to show the Kibana application. For now, this isn’t very useful because Elasticsearch has no logs!

Let’s fix that…

Draining Logs from Cloud Foundry

Cloud Foundry, the open-source project powering IBM Bluemix, supports setting up a syslog drain to forward all applications logs to a third-party logging service. Full details on configuring this will be shown later.

Scott Frederick has already written an amazing blog post about configuring Logstash to support the log format used by the Cloud Foundry. Logstash expects the older RFC3164 syslog formatting by default, whilst Cloud Foundry emits log lines that follow the newer RFC5424 standard.

Scott provides the following configuration file that sets up the syslog input channels, running on port 5000, along with a custom filter that converts the incoming RFC5424 logs into an acceptable format.

1
2
3
4
5
6
7
8
9
10
11
12
13
14
15
16
17
18
19
20
21
22
23
24
25
26
27
28
29
30
31
32
33
34
35
input {
  tcp {
    port => 5000
    type => syslog
  }
  udp {
    port => 5000
    type => syslog
  }
}

filter {
  if [type] == "syslog" {
    grok {
      match => { "message" => "%{SYSLOG5424PRI}%{NONNEGINT:syslog5424_ver} +(?:%{TIMESTAMP_ISO8601:syslog5424_ts}|-) +(?:%{HOSTNAME:syslog5424_host}|-) +(?:%{NOTSPACE:syslog5424_app}|-) +(?:%{NOTSPACE:syslog5424_proc}|-) +(?:%{WORD:syslog5424_msgid}|-) +(?:%{SYSLOG5424SD:syslog5424_sd}|-|) +%{GREEDYDATA:syslog5424_msg}" }
    }
    syslog_pri { }
    date {
      match => [ "syslog_timestamp", "MMM  d HH:mm:ss", "MMM dd HH:mm:ss" ]
    }
    if !("_grokparsefailure" in [tags]) {
      mutate {
        replace => [ "@source_host", "%{syslog_hostname}" ]
        replace => [ "@message", "%{syslog_message}" ]
      }
    }
    mutate {
      remove_field => [ "syslog_hostname", "syslog_message", "syslog_timestamp" ]
    }
  }
}

output {
  elasticsearch { }
}

Using this configuration, Logstash will accept and index our application logs into Elasticsearch.

Note: There is also a custom plugin to enable RFC5424 support.

Building Custom Docker Images

Using the custom Logstash configuration relies on building a new Docker image with this configuration baked in. We could download the Git repository containing the image source files, modify those and rebuild from scratch. However, an easier way uses the existing image as a base, applies our modifications on top and then generates a brand new image.

So, how do we build our own Docker images? Using a Dockerfile.

A Dockerfile is a text document that contains all the commands you would
normally execute manually in order to build a Docker image.

Reviewing the Dockerfile for the sebp/elk image, configuration for logstash is stored in the /etc/logstash/conf.d/ directory. All we need to do is replace these files with our custom configuration.

Creating the custom configuration locally, we define a Dockerfile with instructions for building our image.

1
2
3
4
5
6
7
$ ls
01-syslog-input.conf 10-syslog.conf       Dockerfile
$ cat Dockerfile
FROM sebp/elk
RUN rm /etc/logstash/conf.d/01-lumberjack-input.conf
ADD ./01-syslog-input.conf /etc/logstash/conf.d/01-syslog-input.conf
ADD ./10-syslog.conf /etc/logstash/conf.d/10-syslog.conf

The Dockerfile starts with the “sebp/elk” image as a base layer. Using the RUN command, we execute a command to remove existing input configuration. After this the ADD command copies files from our local directory into the image.

We can now run the Docker build system to generate our new image.

1
2
3
4
5
6
7
8
9
10
11
12
13
14
15
16
17
18
$ docker build -t jthomas/elk .
Sending build context to Docker daemon 4.608 kB
Sending build context to Docker daemon
Step 0 : FROM sebp/elk
 ---> 2b71e915297f
Step 1 : RUN rm /etc/logstash/conf.d/01-lumberjack-input.conf
 ---> Using cache
 ---> f196b6833121
Step 2 : ADD ./01-syslog-input.conf /etc/logstash/conf.d/01-syslog-input.conf
 ---> Using cache
 ---> 522ba2c76b00
Step 3 : ADD ./10-syslog.conf /etc/logstash/conf.d/10-syslog.conf
 ---> Using cache
 ---> 79256ffaac3b
Successfully built 79256ffaac3b
$ docker images jthomas/elk
REPOSITORY          TAG                 IMAGE ID            CREATED             VIRTUAL SIZE
jthomas/elk         latest              79256ffaac3b        26 hours ago        1.027 GB

…and that’s it! We have a customised Docker image with our configuration changes ready for running.

Testing Our Custom Image

Before pushing this image to the cloud, we need to check it’s working correctly. Let’s start by starting a new container from our custom image locally.

1
$ docker run -p 5601:5601 -p 9200:9200 -p 5000:5000 -it --name elk jthomas/elk

Now, use the CF CLI to access recent logs for a sample application and paste the output into a telnet connection to port 5000 on our container.

1
2
3
4
5
6
7
8
9
10
11
$ cf logs APP_NAME --recent
Connected, dumping recent logs for app debug-testing in org james.thomas@uk.ibm.com / space dev as james.thomas@uk.ibm.com...

2015-07-02T17:14:47.58+0100 [RTR/1]      OUT nodered-app.mybluemix.net - [02/07/2015:16:14:47 +0000] "GET / HTTP/1.1" 200 0 7720 "-" "Java/1.7.0" 75.126.70.42:56147 x_forwarded_for:"-" vcap_request_id:1280fe18-e53a-4bd4-40a9-2aaf7c53cc54 response_time:0.003247100 app_id:f18c2dea-7649-4567-9532-473797b0818d
2015-07-02T17:15:44.56+0100 [RTR/2]      OUT nodered-app.mybluemix.net - [02/07/2015:16:15:44 +0000] "GET / HTTP/1.1" 200 0 7720 "-" "Java/1.7.0" 75.126.70.43:38807 x_forwarded_for:"-" vcap_request_id:4dd96d84-c61d-45ec-772a-289ab2f37c67 response_time:0.003848360 app_id:f18c2dea-7649-4567-9532-473797b0818d
2015-07-02T17:16:29.61+0100 [RTR/2]      OUT nodered-app.mybluemix.net - [02/07/2015:16:14:29 +0000] "GET /red/comms HTTP/1.1" 101 0 0 "-" "Mozilla/5.0 (Macintosh; Intel Mac OS X 10_10_3) AppleWebKit/537.36 (KHTML, like Gecko) Chrome/43.0.2357.130 Safari/537.36" 75.126.70.42:54826 x_forwarded_for:"75.126.70.42" vcap_request_id:15c2d4f8-e6ba-4a20-77b7-345aafd32e95 response_time:MissingFinishedAt app_id:f18c2dea-7649-4567-9532-473797b0818d
$ telnet 192.168.59.103 5000
Trying 192.168.59.103...
Connected to 192.168.59.103.
Escape character is '^]'.
// PASTE LOG LINES....

Starting a web browser and opening the Kibana page, port 5601, the log lines are now available in the dashboard. Success!

Pushing Docker Images To The Cloud

Having successfully built and tested our custom Docker image locally, we want to push this image to our cloud platform to allow us to start new containers based on this image.

Docker supports pushing local images to the public registry using the docker push command. We can choose to use a private registry by creating a new image tag which prefixes the repository location in the name.

IBM Containers’ private registry is available at the following address, registry.ng.bluemix.net.

Let’s push our custom image to the IBM Containers private registry…

1
2
3
4
5
6
7
8
9
10
11
12
13
$ docker tag jthomas/elk registry.ng.bluemix.net/jthomas/elk
$ docker images
REPOSITORY                                     TAG                 IMAGE ID            CREATED             VIRTUAL SIZE
jthomas/elk                                   latest              79256ffaac3b        43 hours ago        1.027 GB
registry.ng.bluemix.net/jthomas/elk           latest              79256ffaac3b        43 hours ago        1.027 GB
$ docker push registry.ng.bluemix.net/jthomas/elk
The push refers to a repository [registry.ng.bluemix.net/jthomas/elk] (len: 1)
Sending image list
Pushing repository registry.ng.bluemix.net/jthomas/elk (1 tags)
511136ea3c5a Image successfully pushed
...
79256ffaac3b: Image successfully pushed
Pushing tag for rev [79256ffaac3b] on {https://registry.ng.bluemix.net/v1/repositories/jthomas/elk/tags/latest}

Pushing custom images from a local environment can be a slow process. For the elk image, this means transferring over one gigabyte of data to the external registry.

We can speed this up by using IBM Containers to create our image from the Dockerfile, rather than uploading the built image.

Doing this from the command line requires the use of the IBM Containers command-line application.

Managing IBM Containers

IBM Containers enables you to manage your containers from the command-line with two options

Both approaches handle the interactions between the local and remote Docker hosts, while providing extra functionality not supported natively by Docker.

Full details on the differences and installation procedures for the two applications are available here.

Building Images Using IBM Containers

Building our image using the IBM Containers service uses the same syntax as Docker build. Local files from the current directory will be sent with the Dockerfile to the remote service. Once the image has been built, we can verify it’s available in the remote repository.

1
2
3
4
5
6
7
8
9
10
11
12
13
14
15
16
17
18
19
20
21
22
23
24
25
$ ice build -t registry.ng.bluemix.net/jthomas/elk .
zipped tar size: 706
Posting 706 bytes... It may take a while...
Step 0 : FROM sebp/elk
 ---> 2b71e915297f
Step 1 : RUN rm /etc/logstash/conf.d/01-lumberjack-input.conf
 ---> Using cache
 ---> ed13d91e0197
Step 2 : ADD ./01-syslog-input.conf /etc/logstash/conf.d/01-syslog-input.conf
 ---> Using cache
 ---> 808a4c7410c7
Step 3 : ADD ./10-syslog.conf /etc/logstash/conf.d/10-syslog.conf
 ---> Using cache
 ---> 117e4454b015
Successfully built 117e4454b015
The push refers to a repository [registry.ng.bluemix.net/jthomas/elk] (len: 1)
Sending image list
Pushing repository registry.ng.bluemix.net/jthomas/elk (1 tags)
Image 117e4454b015 already pushed, skipping
Pushing tag for rev [117e4454b015] on {https://registry.ng.bluemix.net/v1/repositories/jthomas/elk/tags/latest}
$ ice images
REPOSITORY                                TAG                 IMAGE ID            CREATED             VIRTUAL SIZE
registry.ng.bluemix.net/jthomas/elk       latest              5454d3ec-0f3        44 hours ago        0 B
registry.ng.bluemix.net/ibmliberty        latest              3724d2e0-06d        9 days ago          0 B
registry.ng.bluemix.net/ibmnode           latest              9435349e-8b4        9 days ago          0 B

All private repositories on IBM Bluemix have two official images for supported versions of NodeJS and Websphere Liberty.

We can now see the third image is the custom ELK stack that was built.

Starting ELK Containers

Starting containers from images in the IBM Containers registry can be done using the command-line applications or through the IBM Bluemix UI. In this example, we’ll be using the IBM Bluemix UI to start and configure a new ELK container from our pre-configured image.

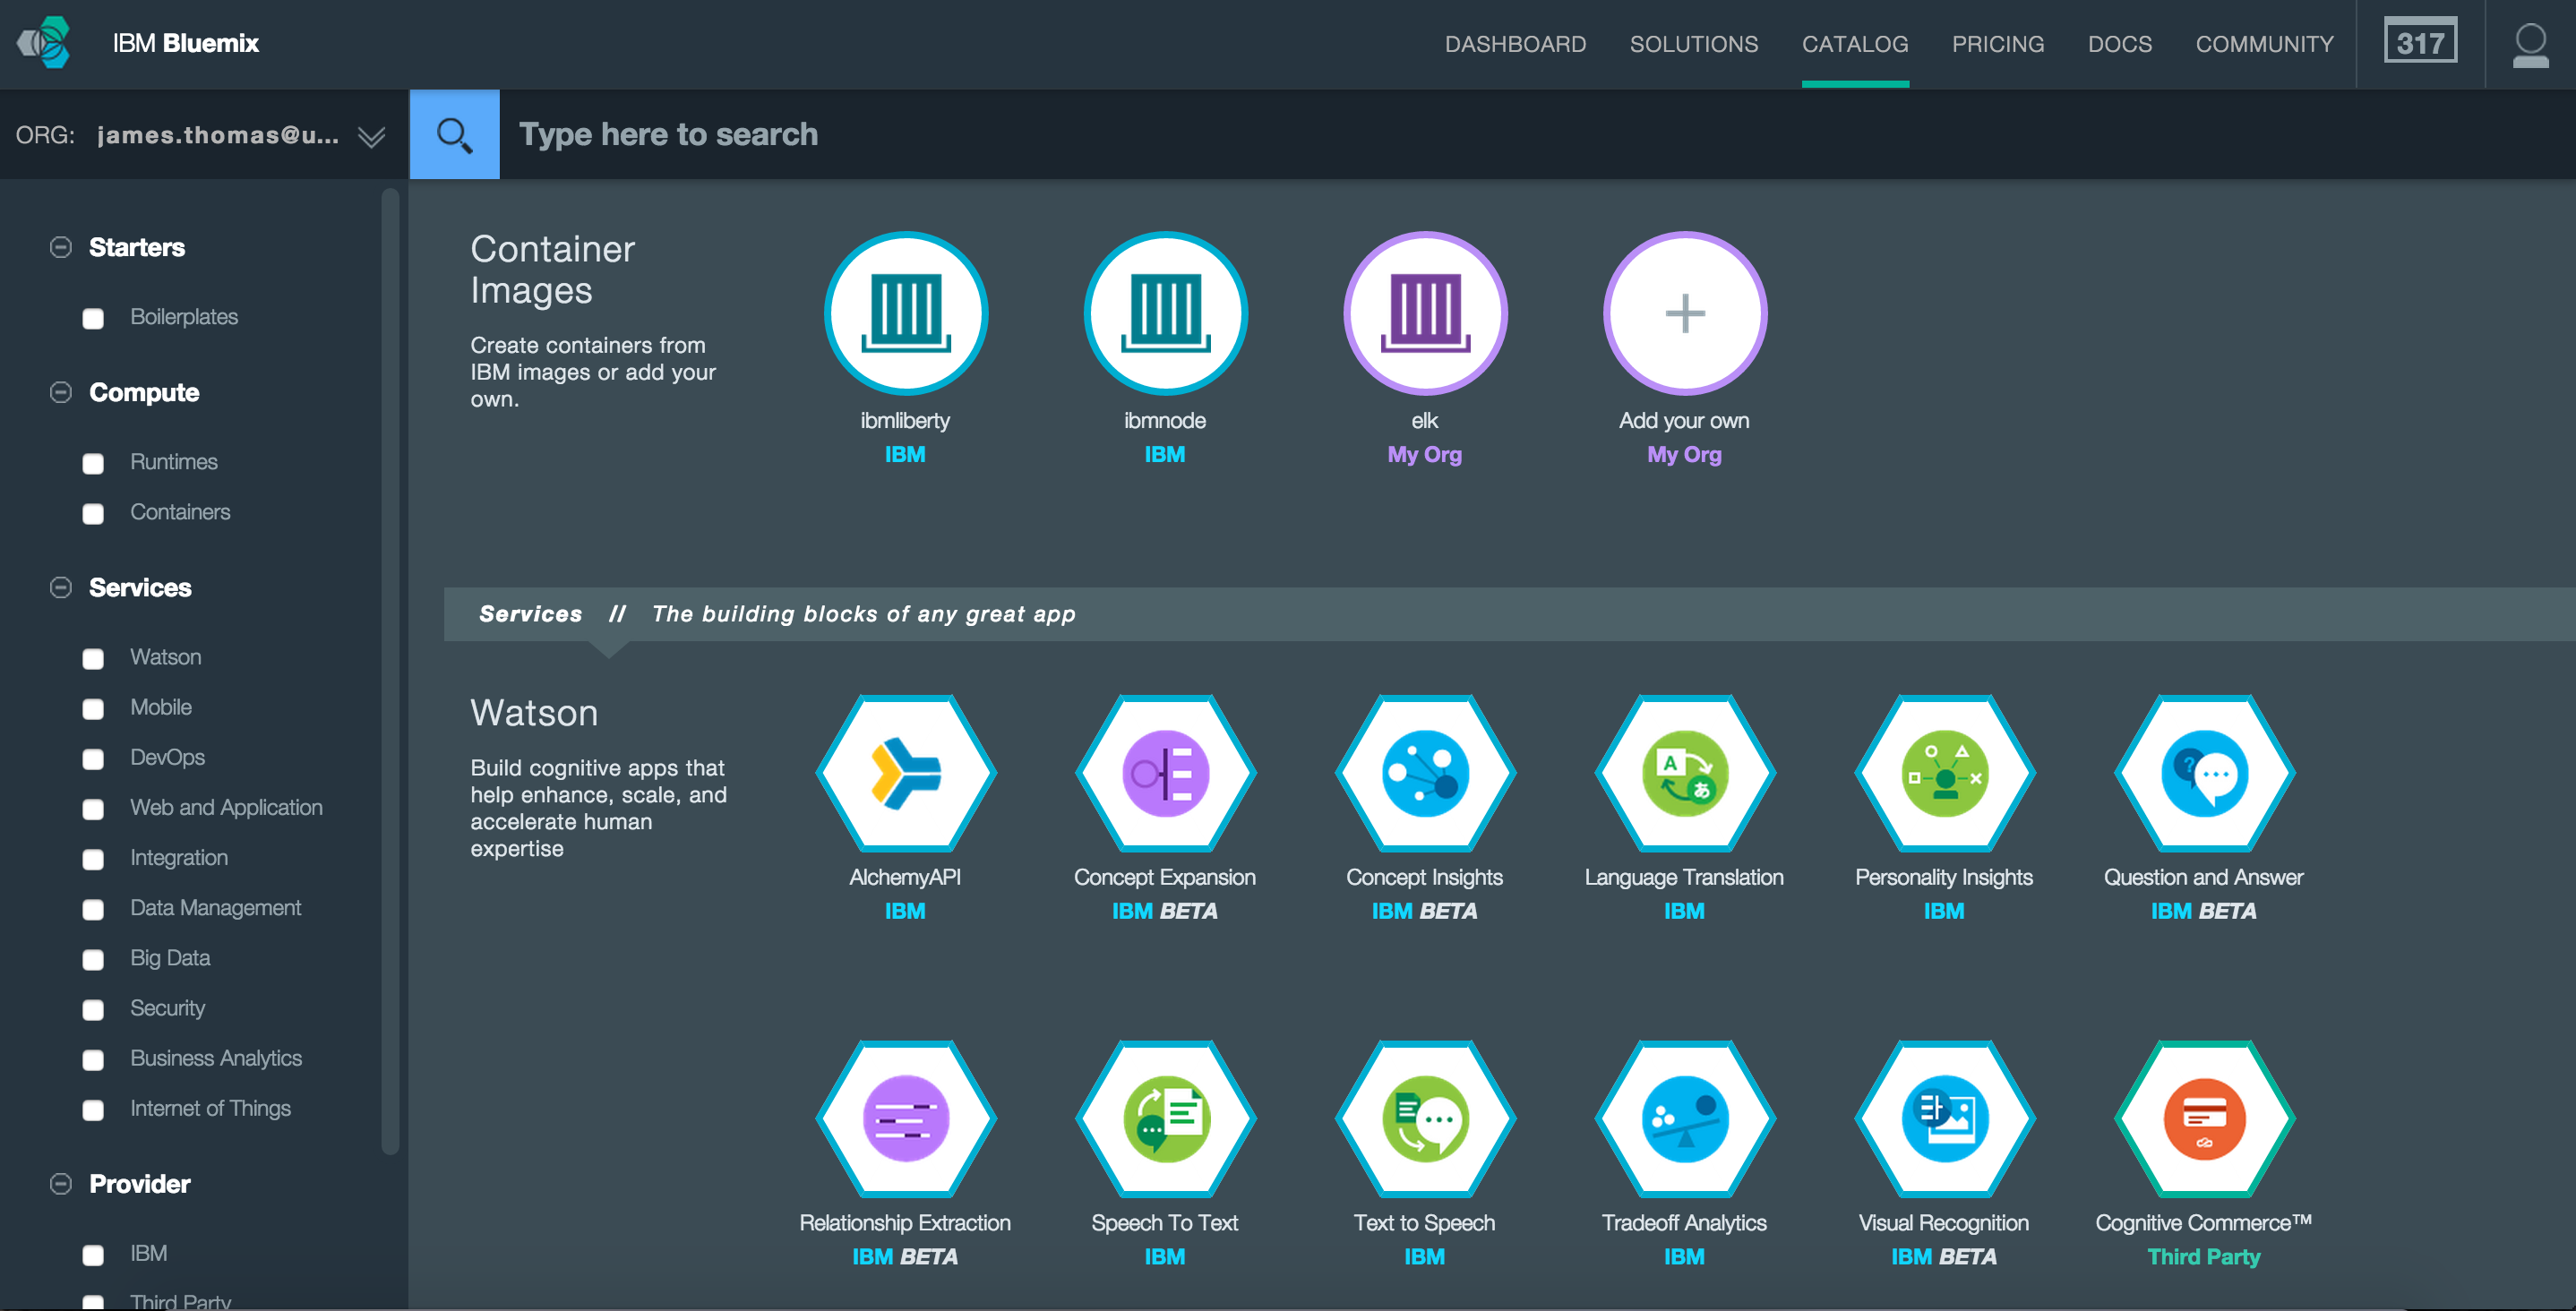
Logging into the IBM Bluemix, the Catalogue page shows the list of available images used to create new containers. We have both the official images from IBM Containers and our custom ELK service.

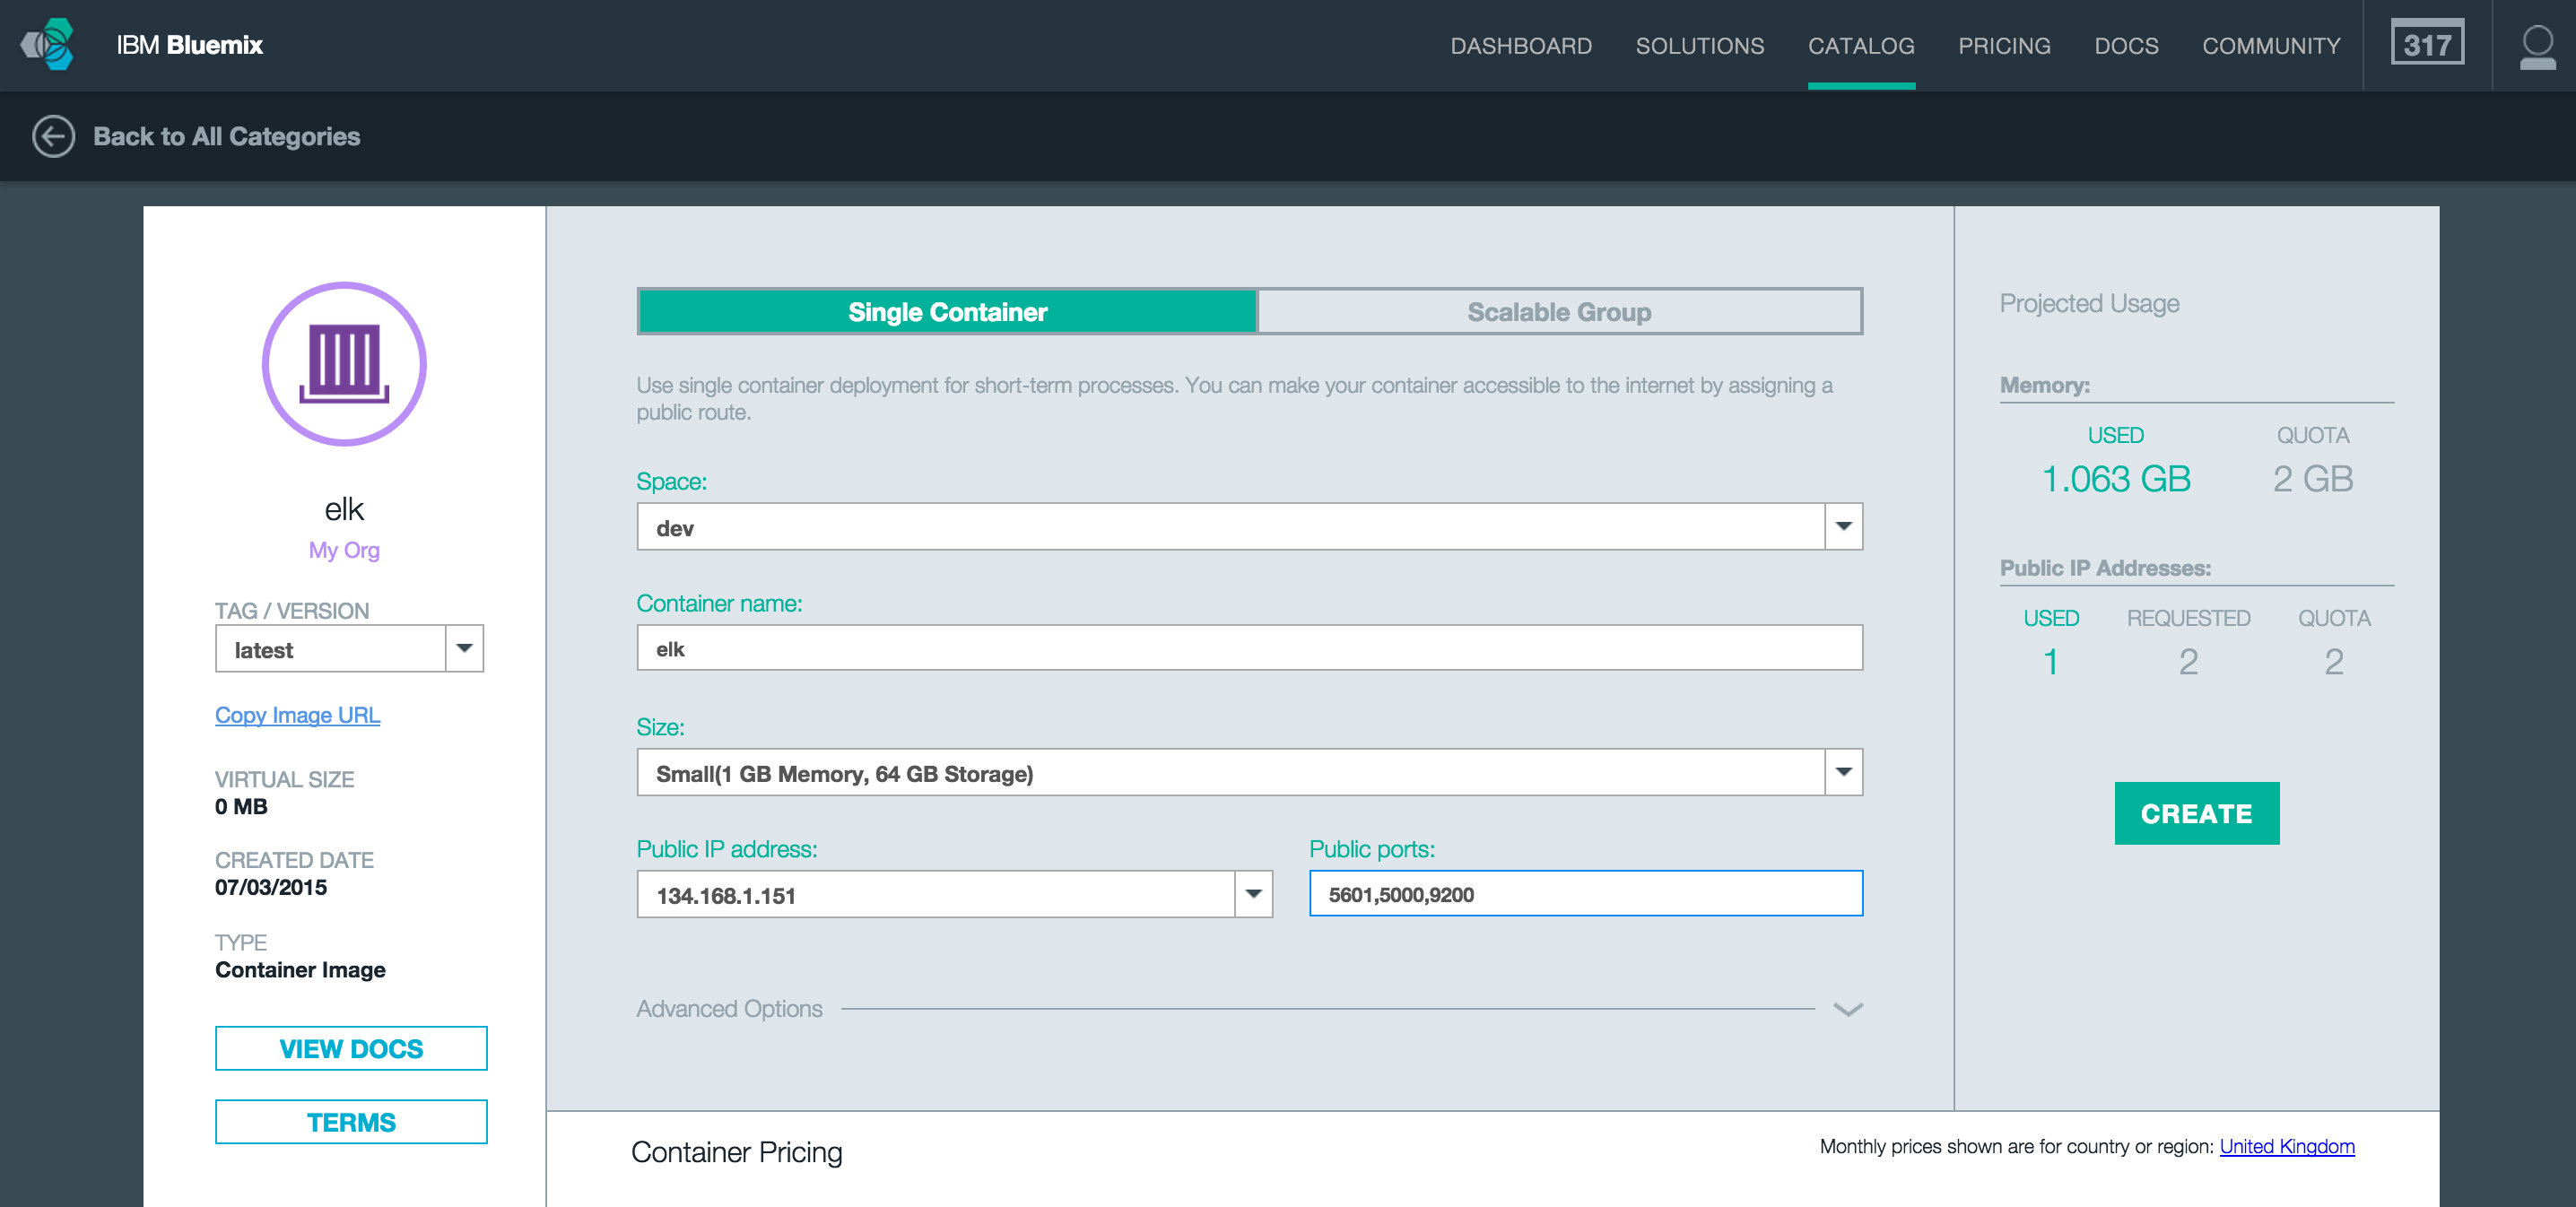
Selecting the ELK image, we can configure and run a new container from this image. Setting up a new container with a public IP address, memory limit to 1GB and expose the same ports as running locally (5000, 5601 and 9200).

Clicking the Create button, IBM Bluemix will provision and start our new container.

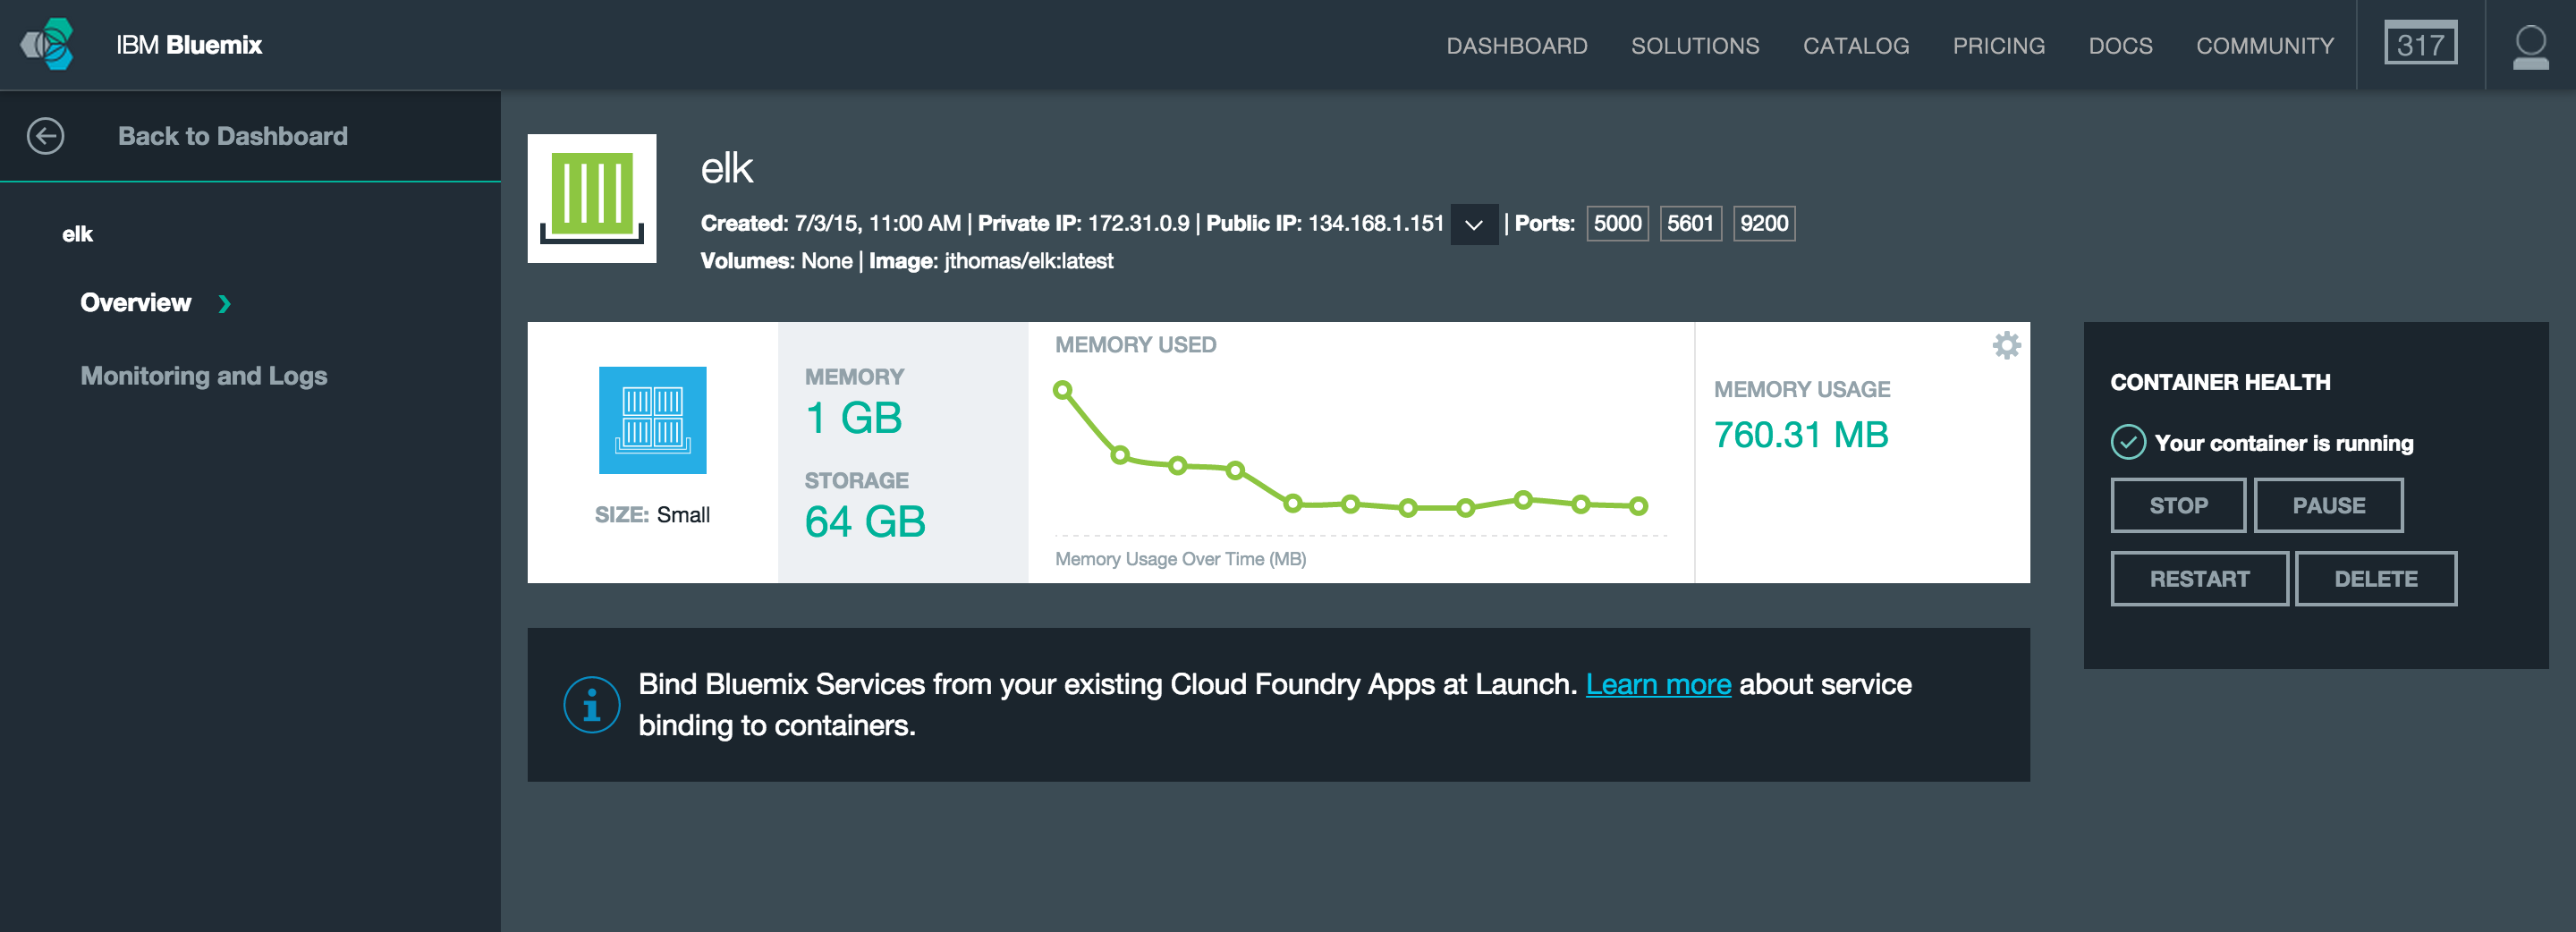
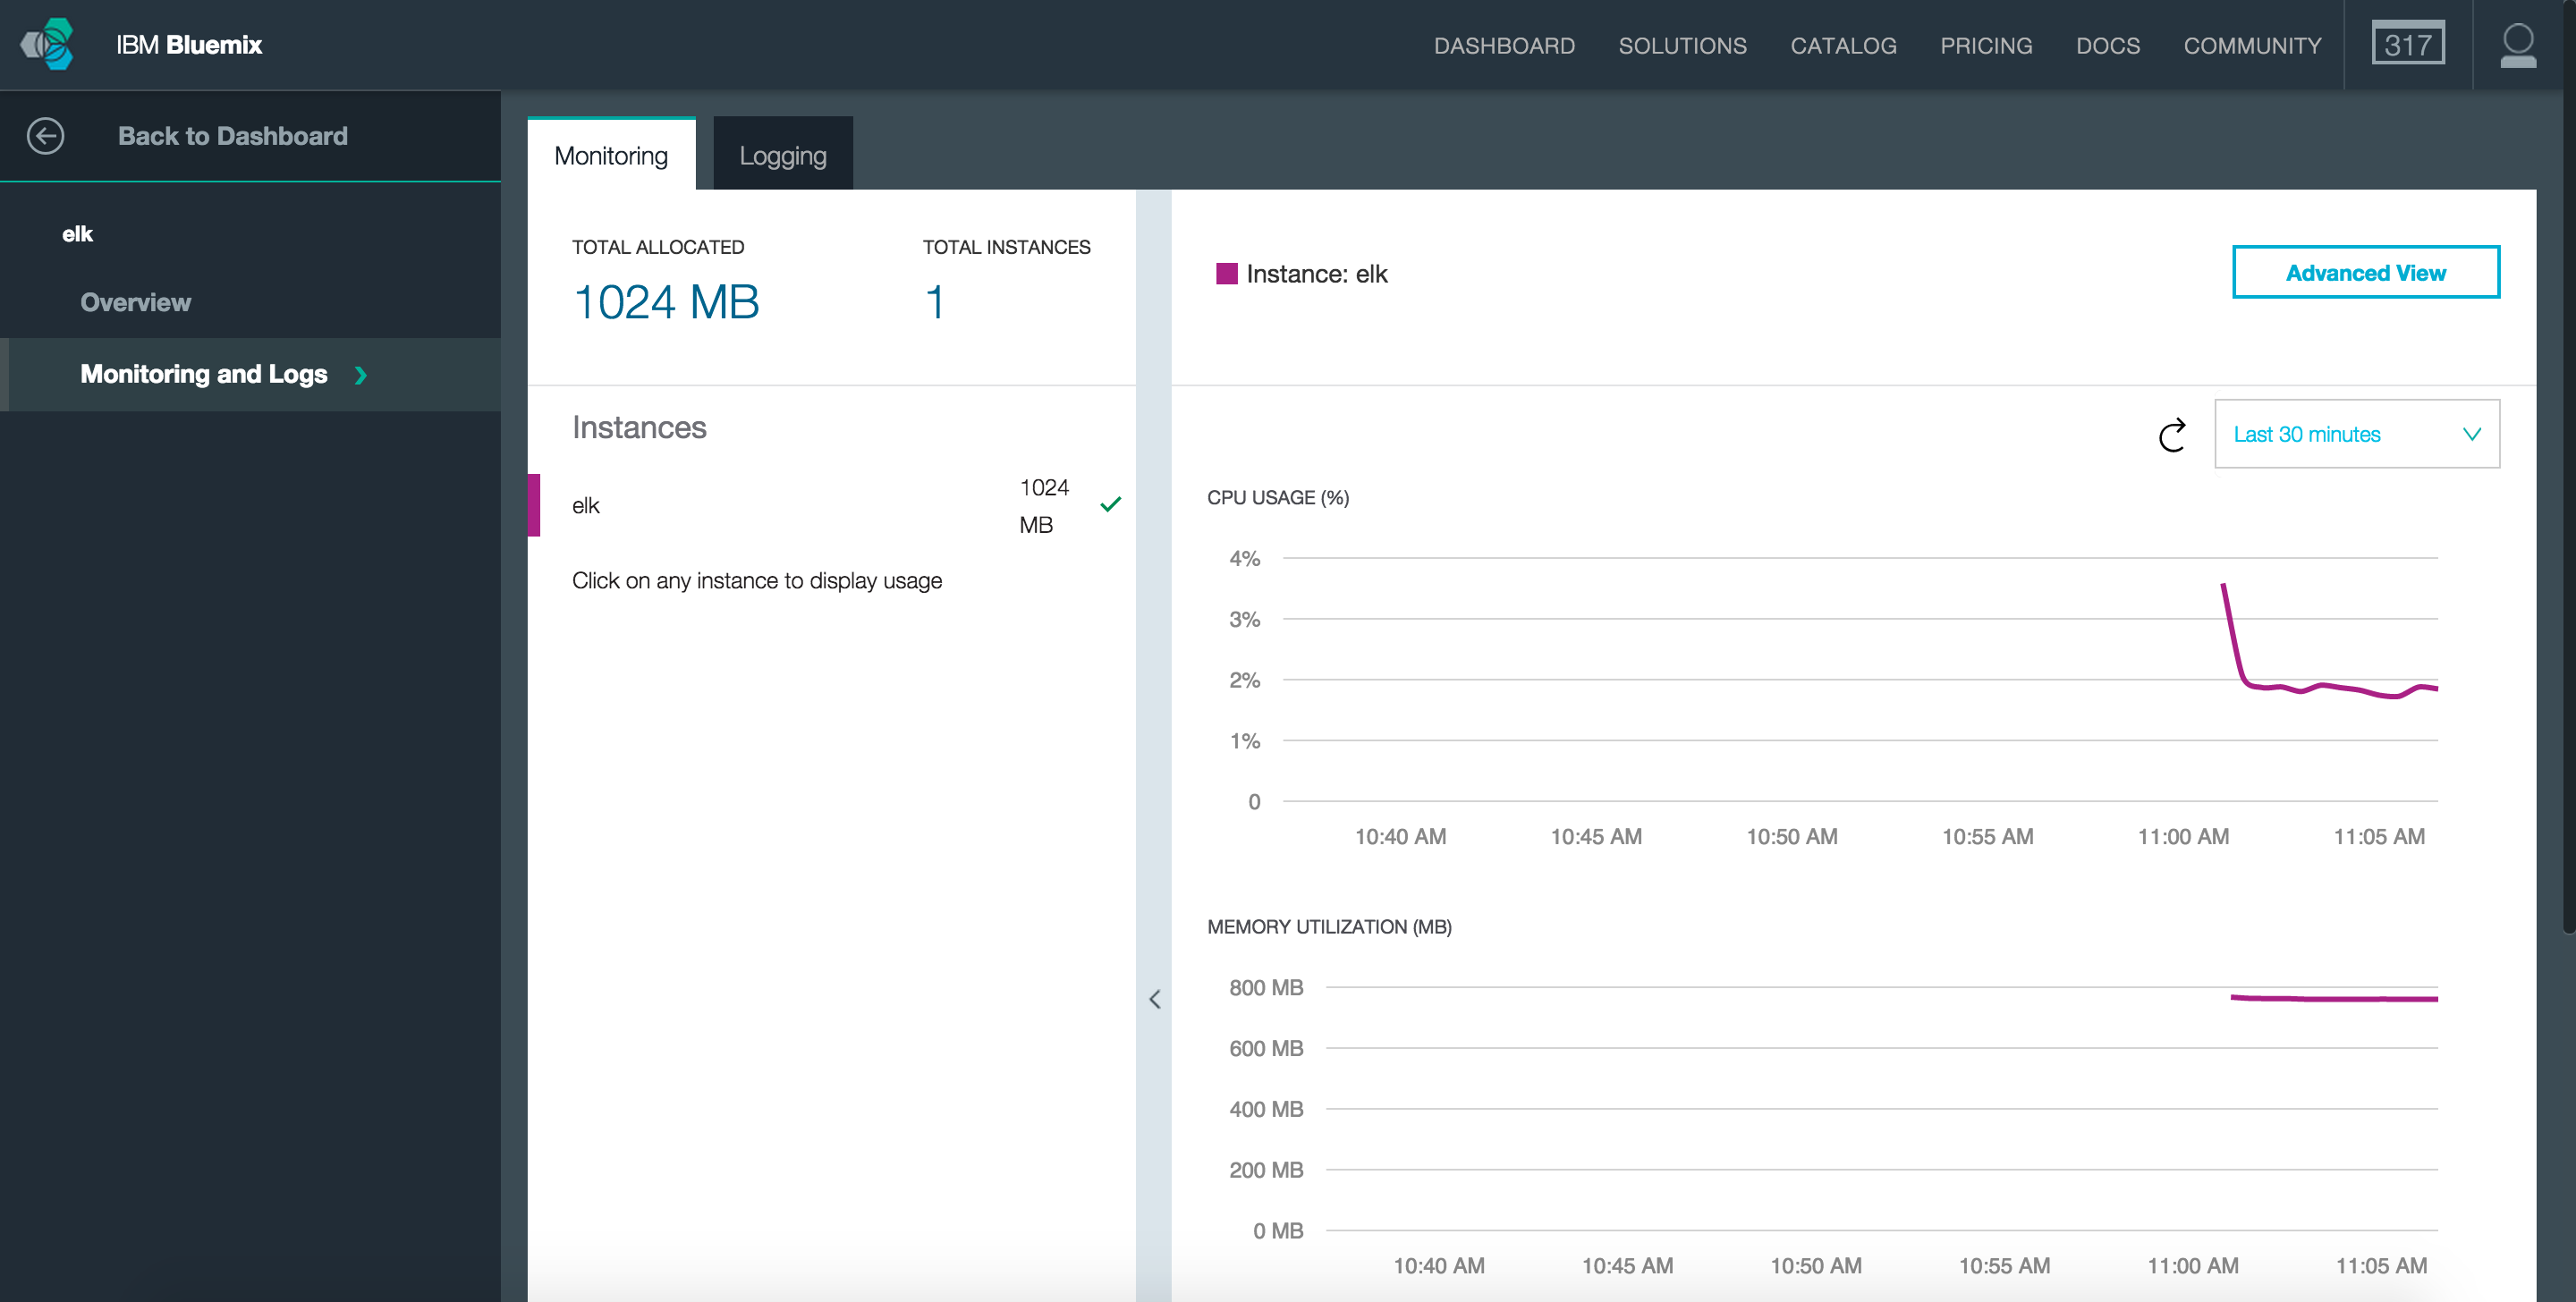
Once the container has started, we can view the Dashboard page for this instance. Here we can view details about the container instance, modify the running state and access monitoring and logs tools.

…and that’s it! We now have our ELK service running using IBM Containers ready to start processing logs from our applications.

Visiting the external IP address assigned to the container on the Kibana application port (5601) shows the Kibana web interface demonstrating our container has started correctly.

Draining Cloud Foundry Logs

Cloud Foundry supports draining applications logs to a third-party syslog service. The ELK container has a syslog drain configured on port 5000 of the public IP address bound to the instance.

Binding this custom syslog drain to Cloud Foundry applications uses a custom user-provided service. Creating user-provided services using the CF CLI, there is a special flag, -l, that notifies the platform this service is a syslog drain. Binding this special syslog drain service to an application will automatically set up log forwarding. Once the application has been restarted, logs will start to flow into the external service.

1
2
3
$ cf cups logstash-drain -l syslog://[CONTAINER_IP]:5000
$ cf bind-service [app-name] logstash-drain
$ cf restart [app-name]

Cloud Foundry supports multiple syslog drains for the same application.

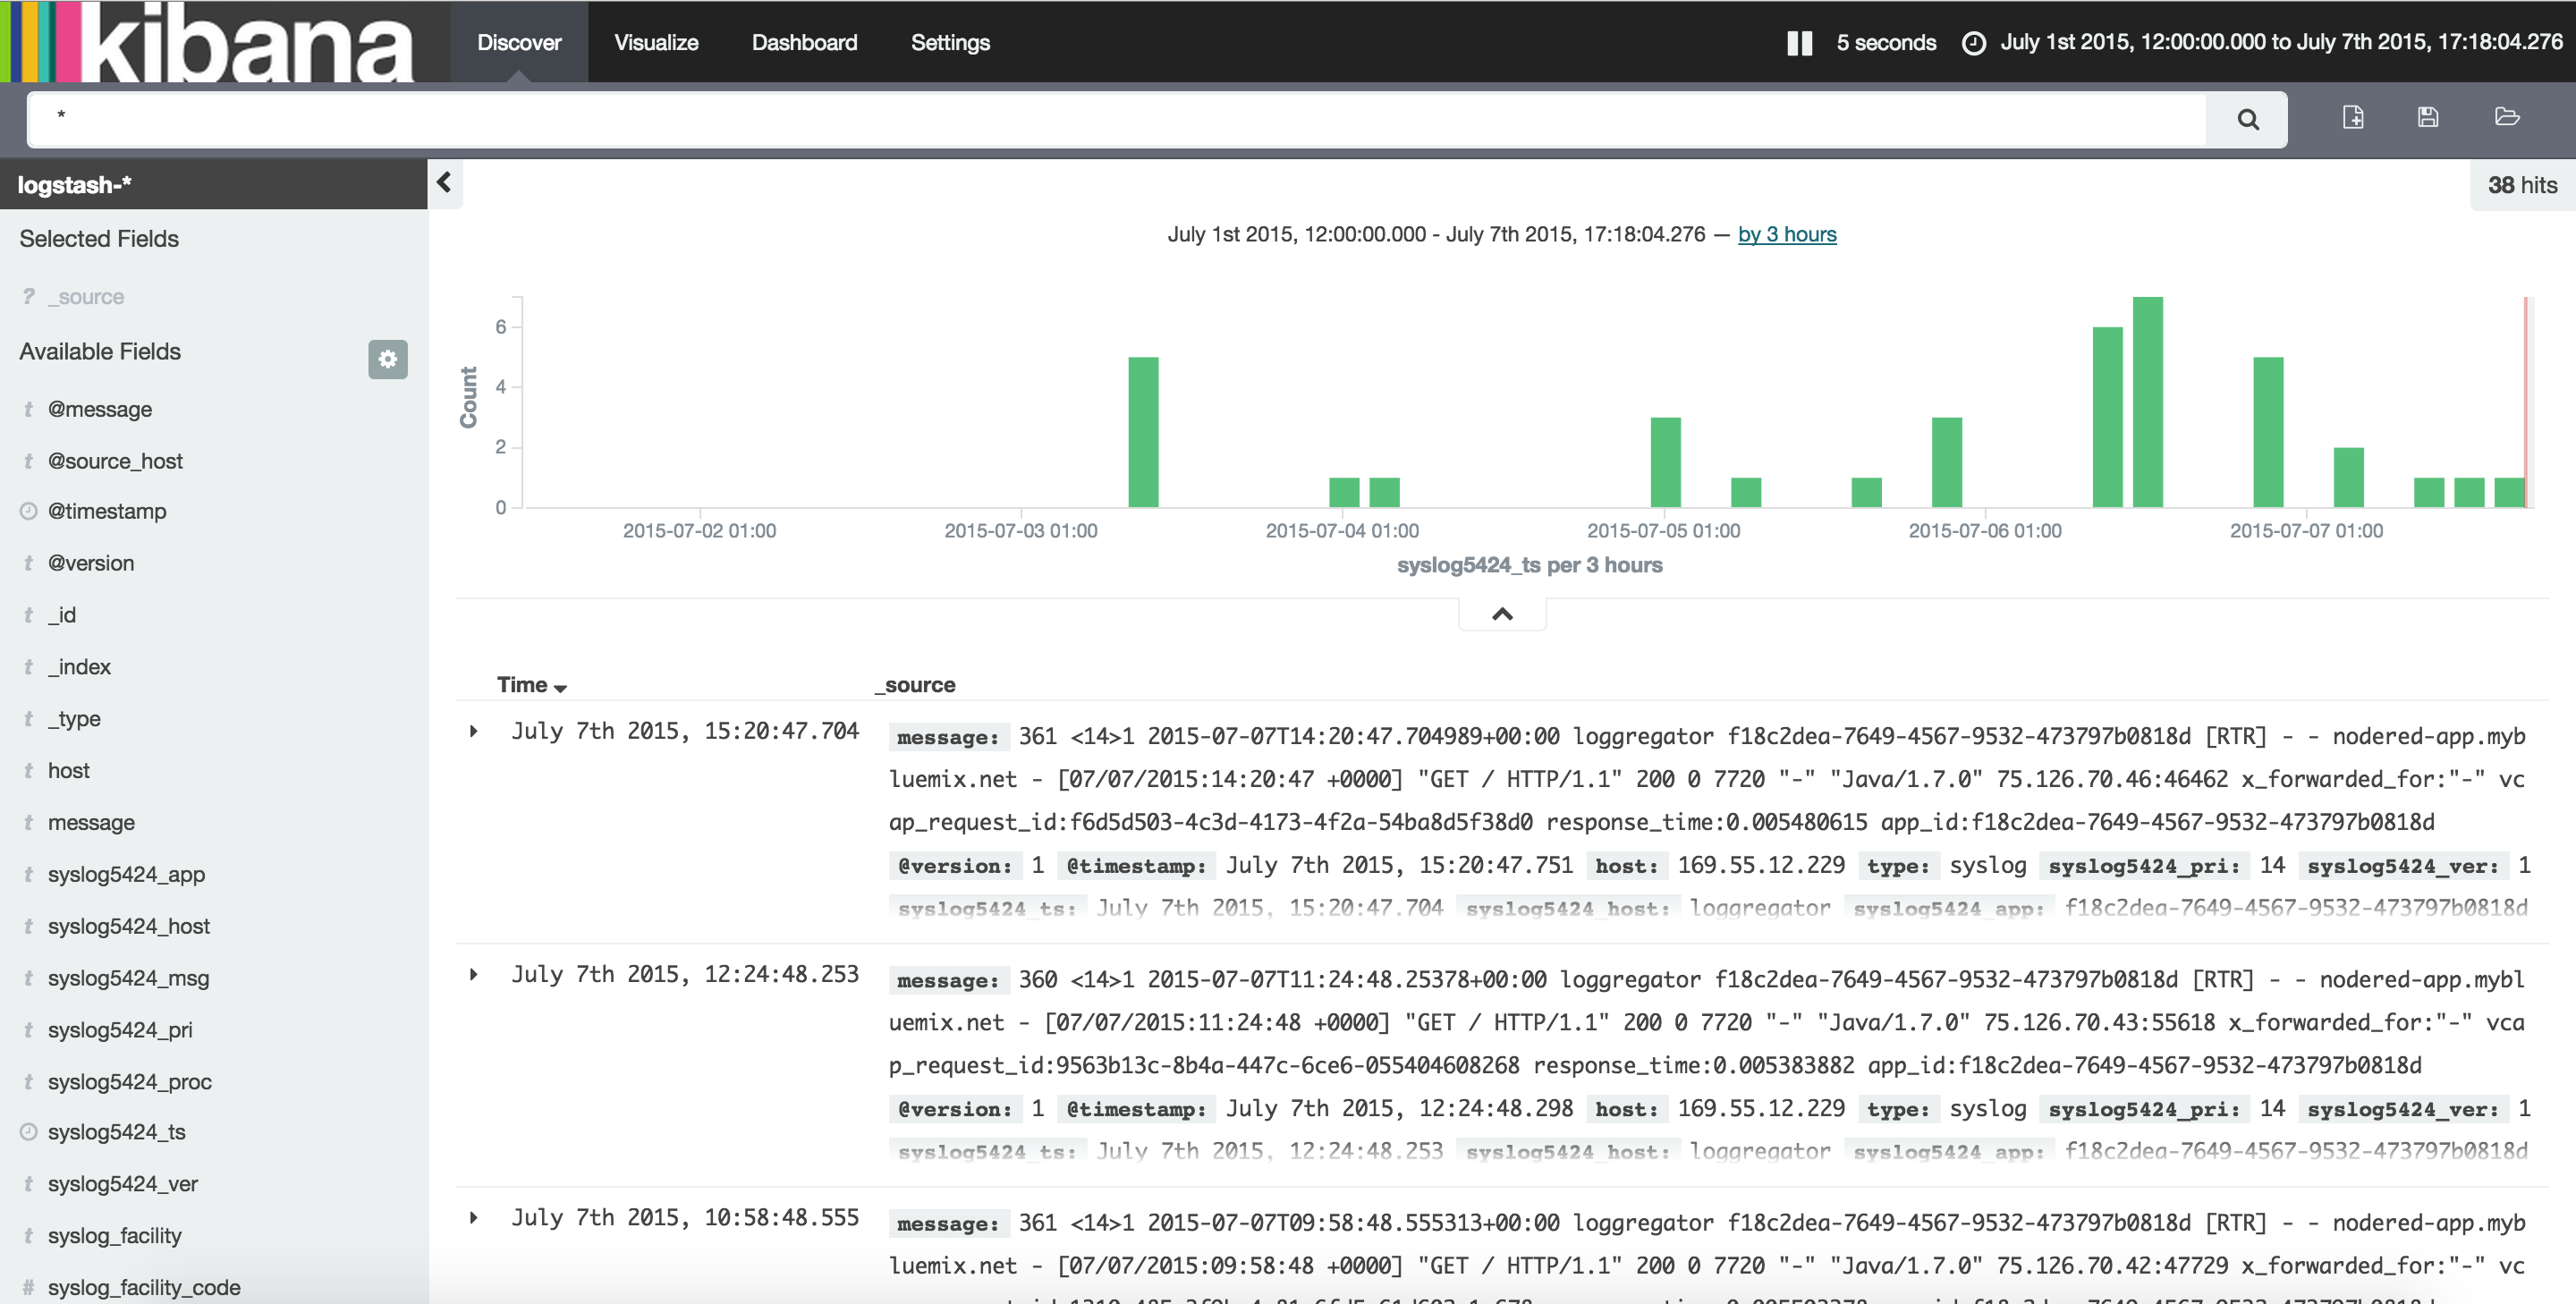
Testing this out is as simple as visiting our application to generate sample logs and then looking at the Kibana page to see they are showing up. Here is a screenshot of the expected output when our ELK container is successfully processing logs from a Cloud Foundry application.

Conclusion

Elastic Search, Kibana and Logstash is the modern log processing framework. Using Docker, we’ve been able to create a custom ELK service without manually installing and configuring a multitude of different software packages. Pushing this image to the IBM Containers platform means we can spin up new ELK containers on-demand within minutes!

Elasticsearch, Docker and IBM Containers… Making Logs Awesome.

Continuous Delivery for Phonebot

Since creating Phonebot last month, I’ve been working on setting up a fully-automated build and deploy for the project. Using IBM DevOps Services, Phonebot now has ”Continuous Delivery” enabled.

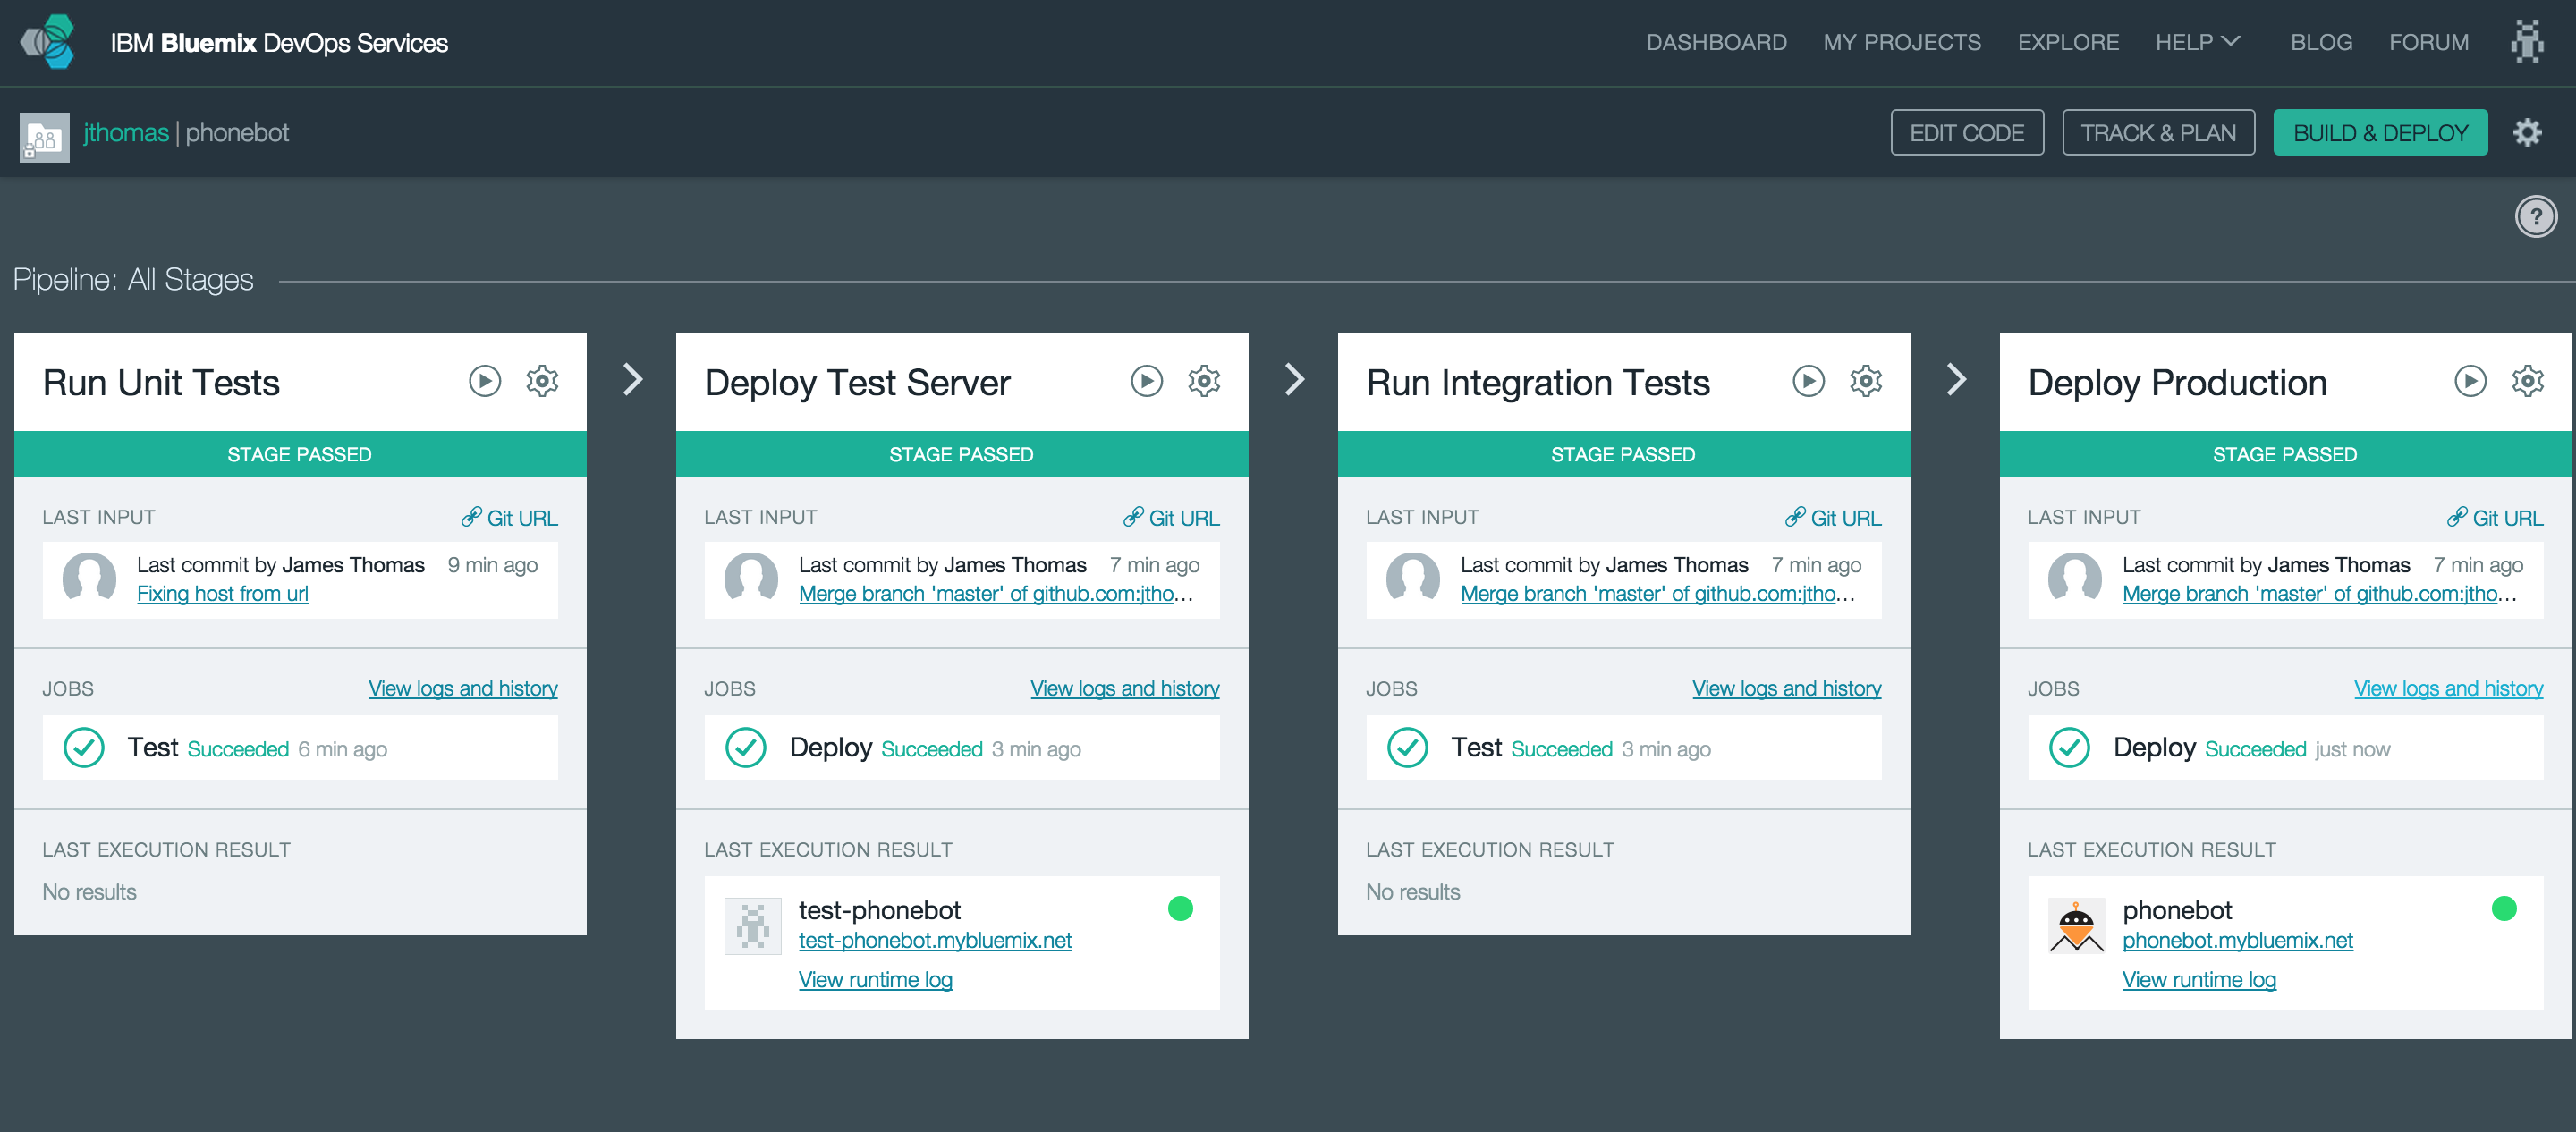
When new code is commited to the external Github repository, the build service will perform the following tasks.

  • Run Unit Tests and Code Lint Tools
  • Deploy To Test Server
  • Run Integration Tests Against Test Server
  • Deploy To Production

Each stage will only be executed if the following stage passes.

In the following post, I’ll explain how to set up each stage and share tips making it easy to replicate this setup for your projects…

Writing Tests for Phonebot

Phonebot comes with a comprehensive test suite. I’ve used the Mocha test framework for creating unit and integration tests. Test assertions use NodeJS’ built-in library. The mockery library is used to replace module dependencies with mock objects.

Setting up the scripts field in package.json allows us to use NPM to run our tests.

NPM will look into the ”node_modules/.bin” directory for binaries when running scripts. This means we don’t need Mocha installed on the deployment host to run tests. The ”devDependencies” field includes modules we rely on during development but not production.

1
2
3
4
5
6
7
8
9
10
"devDependencies": {
    "mocha": "^2.2.5",
    "mocha-eslint": "^0.1.7",
    "mockery": "^1.4.0"
},
"scripts": {
    "test": "mocha test/unit",
    "integration-test": "mocha test/integration",
    "start": "node app.js"
  },

Running the following commands will run the unit and integration tests.

1
2
$ npm test  // defaults to 'run test'
$ npm run integration-test

Running Code Linters

Along with unit tests, we want to run ‘code linters’ to catch any errors in our JavaScript code. We’re using the eslint tool with the following configuration. Using this module, we’re setting up the eslint tool as a test case.

This test will be automatically run in the unit test phase and errors incorporated into the test report.

Mocking Services In Integration Tests

When the unit tests have passed, we’re going to deploy a test instance of the application. Integration tests will make HTTP requests to simulate user activity, capture the responses and then verify the application is behaving as expected.

Phonebot uses external services, provisioned through IBM Bluemix, to make phone calls, translate speech to text and communicate with Slack channels. Services configuration parameters, e.g. username, password, host, are passed into the application using environment variables.

During integration tests, we want to capture all requests to external services and provide hardcoded HTTP responses to be returned. With service parameters coming from environment properties, rather than hardcoded in the application, we can simply replace the bound services configuration with our own values. This application will pick up these new values, pointing to our stub server, at runtime without any changes needed to the code.

This stub server has been created to capture all incoming HTTP requests and make them available at a custom HTTP endpoint. We’re also configured HTTP routes to simulate each of the external services and return hardcoded responses.

Deploying our test server in a different space to production means we can have custom credentials set up without having to modify the service configuration in the production environment.

The following commands will show the existing configuration values that we can replicate in the test environment.

1
2
3
4
5
6
$ cf env phonebot
$ cf create-space test
$ cf target -s test
$ cf cups twilio -p "accountSID, authToken, url"
$ cf cups speech_to_text -p "username, password, url"
$ cf cups slack_webhooks -p "slackbot-testing"

With the test credentials created, we can deploy the application to the “test” space without modifications.

Setting up Build and Deploy Pipeline

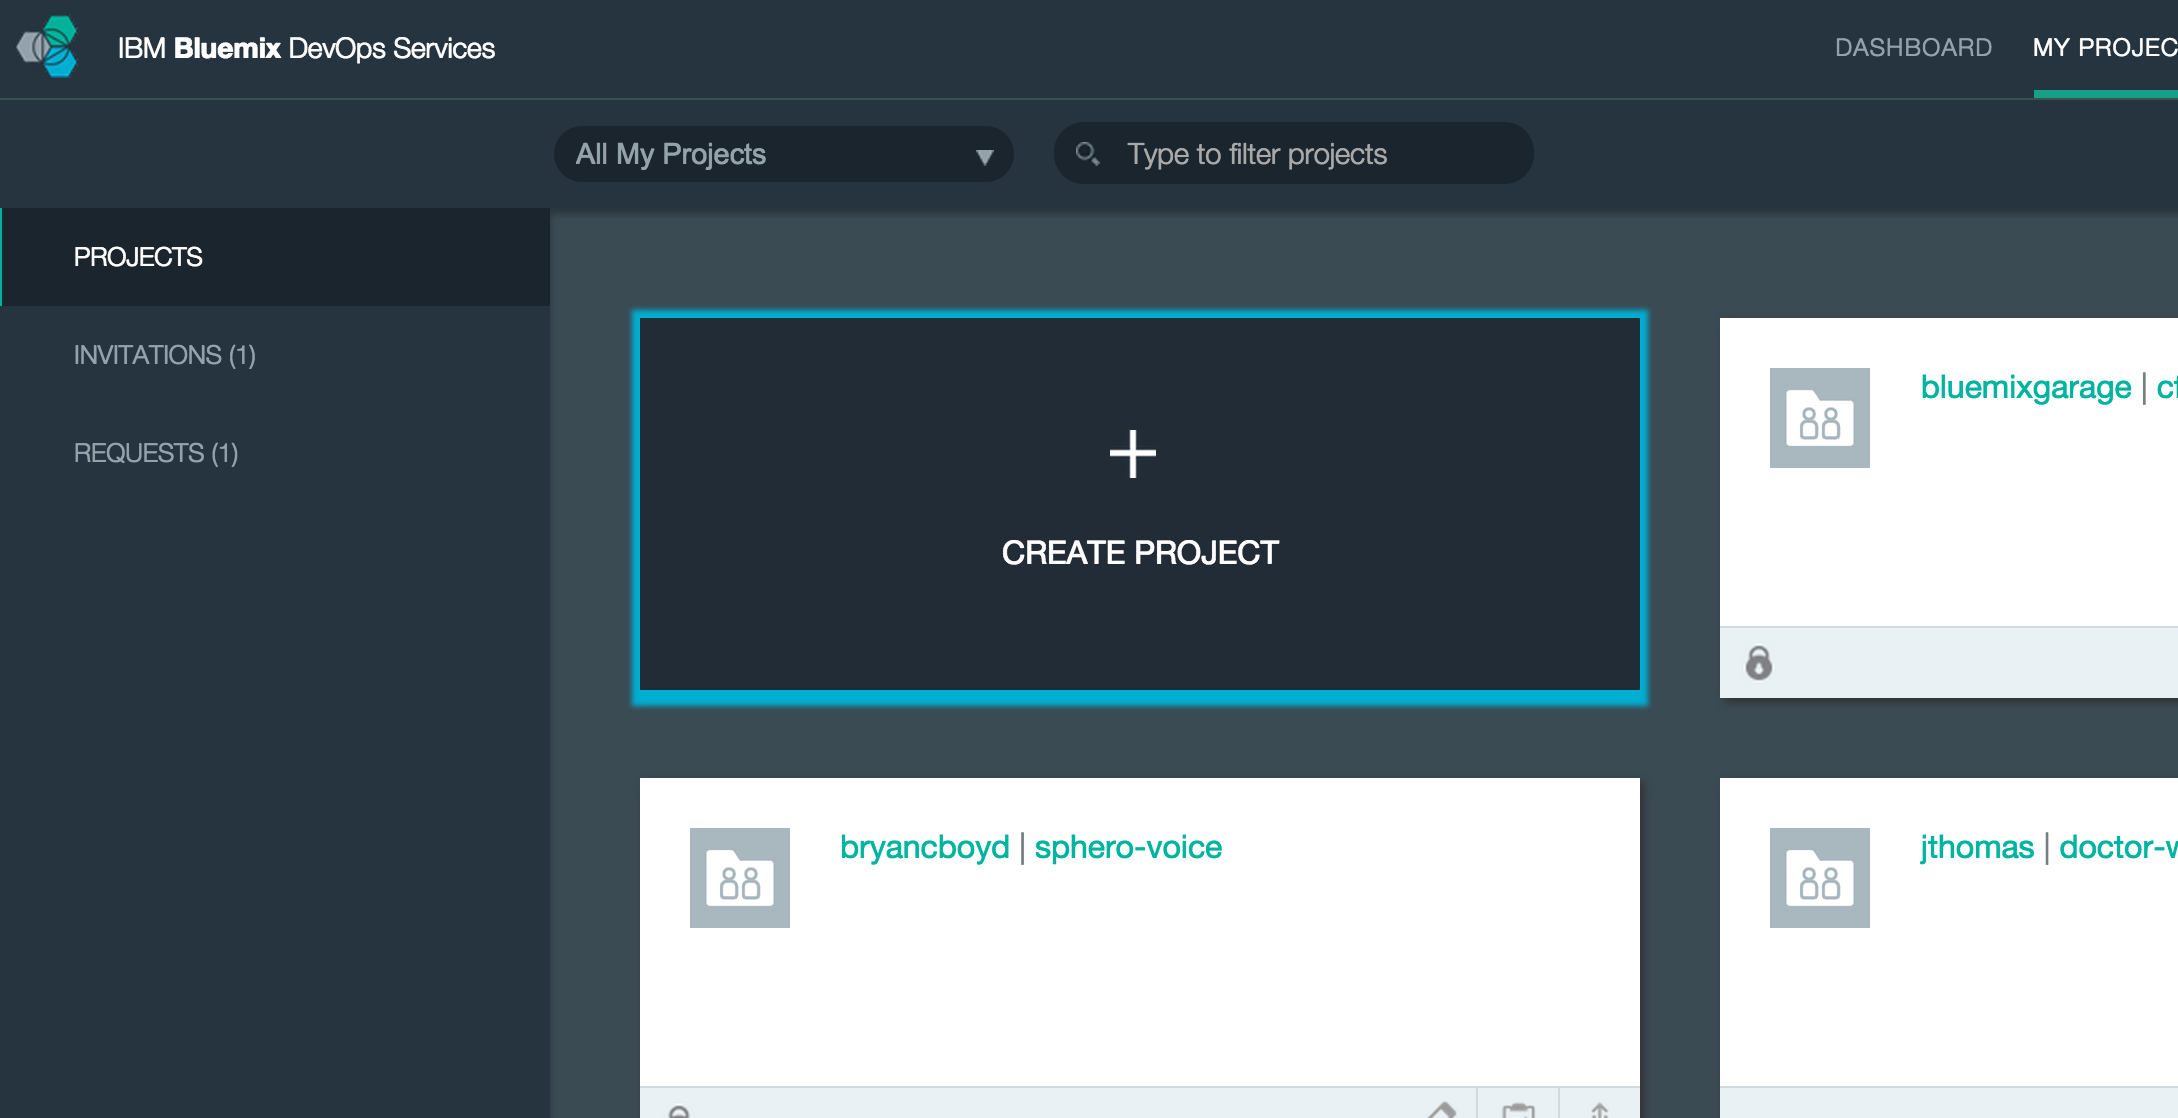
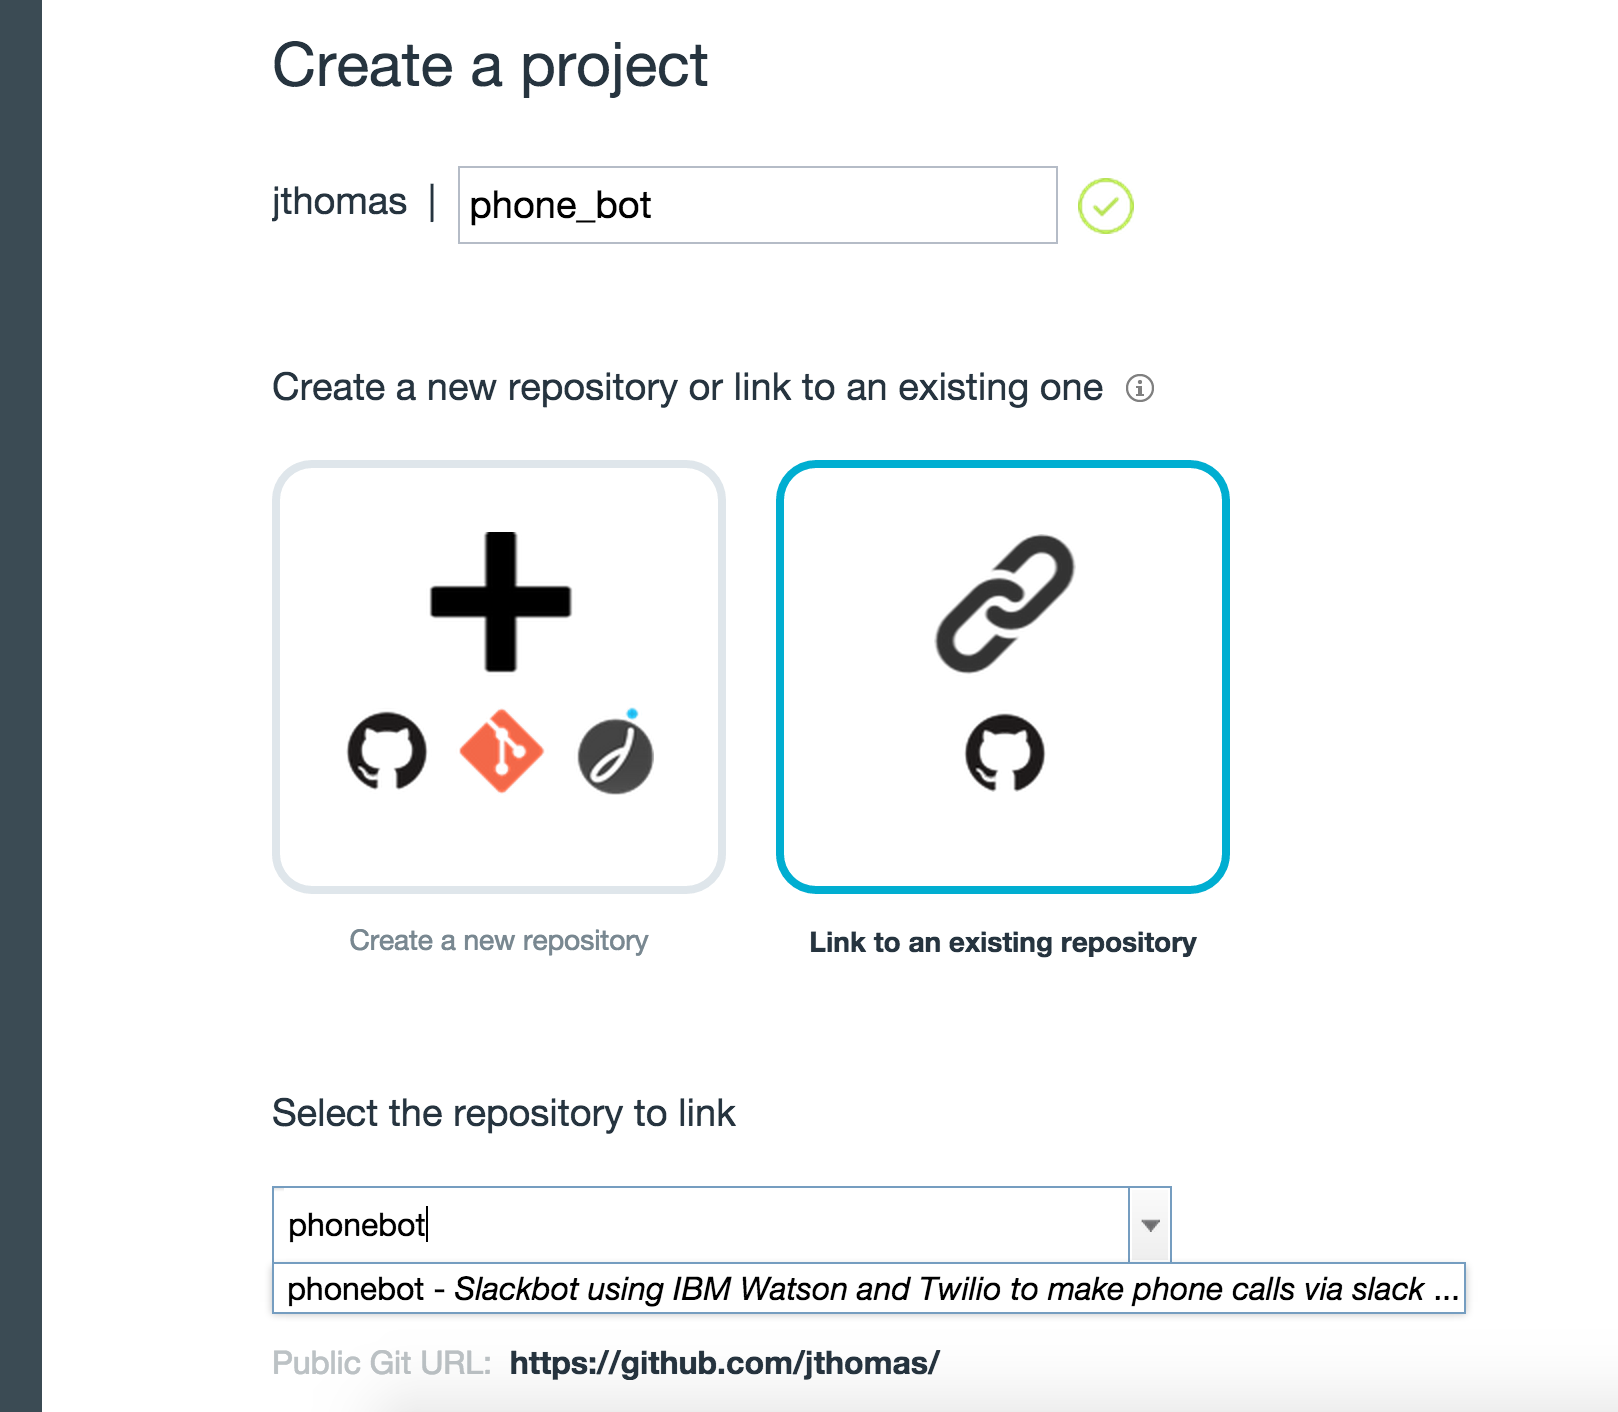
We’re going to use IBM DevOps Services to build and manage the “Continuous Delivery” pipeline. From the home page, click the “Create Project” button to import our existing Github project into the workspace.

The “Create Project” page allows us to link an existing project from Github to the new project. Changes to the external repository will be automatically pushed through to our project.

Selecting the “Make a Bluemix project” option will automatically configure deploying to the Bluemix platform.

When the project has finished importing, we can access the “Build and Deploy” pipeline…

… which will currently be empty. Clicking the “Add Stage” button will allow us to start configuring the build, test and deploy jobs for our pipeline.

Running Unit Tests and Code Lint Tools

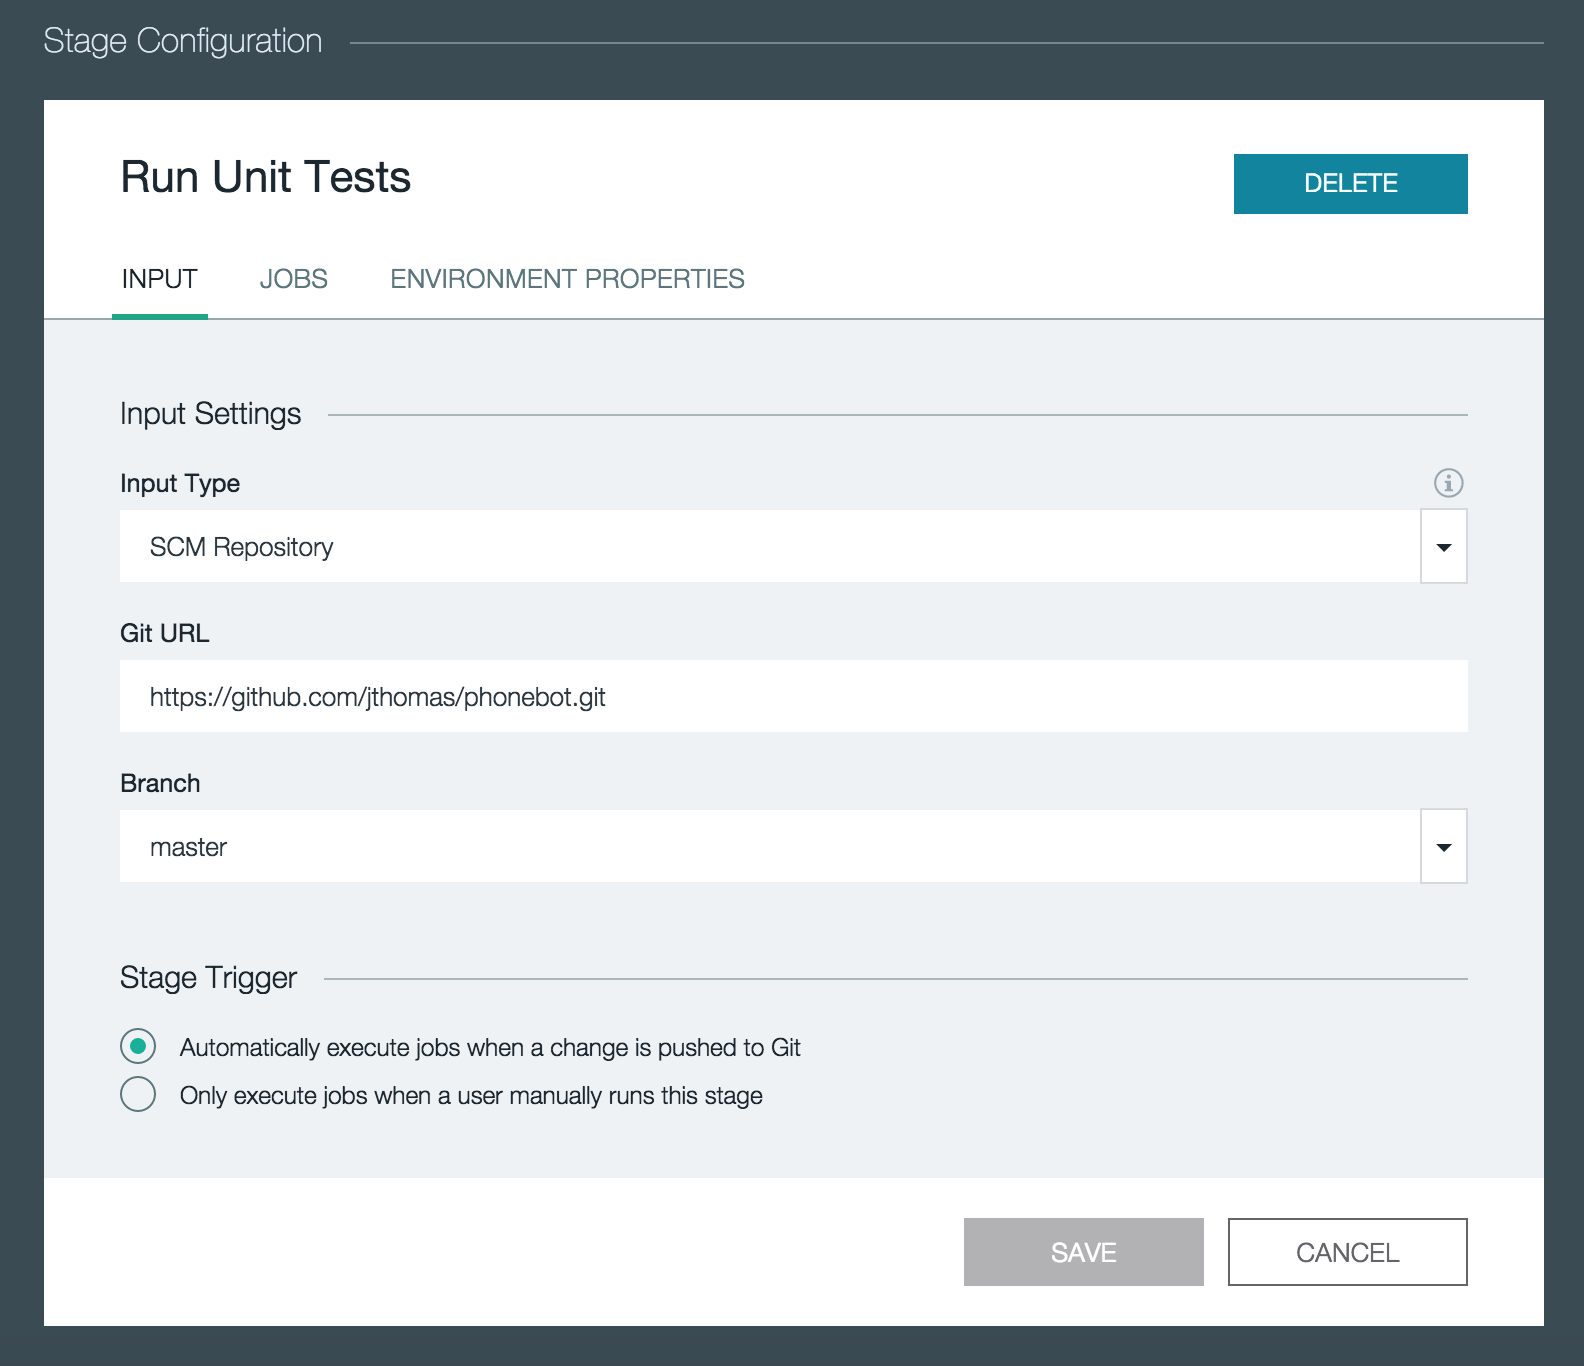
The first stage in our pipeline will run the unit tests when a new commit is published to the Phonebot repository on Github.

Using the “Input” tab, we’re configuring the stage to pick up all changes in the “master” branch of the https://github.com/jthomas/phonebot.git repository. The input for a stage can also be the build artifacts from a previous stage.

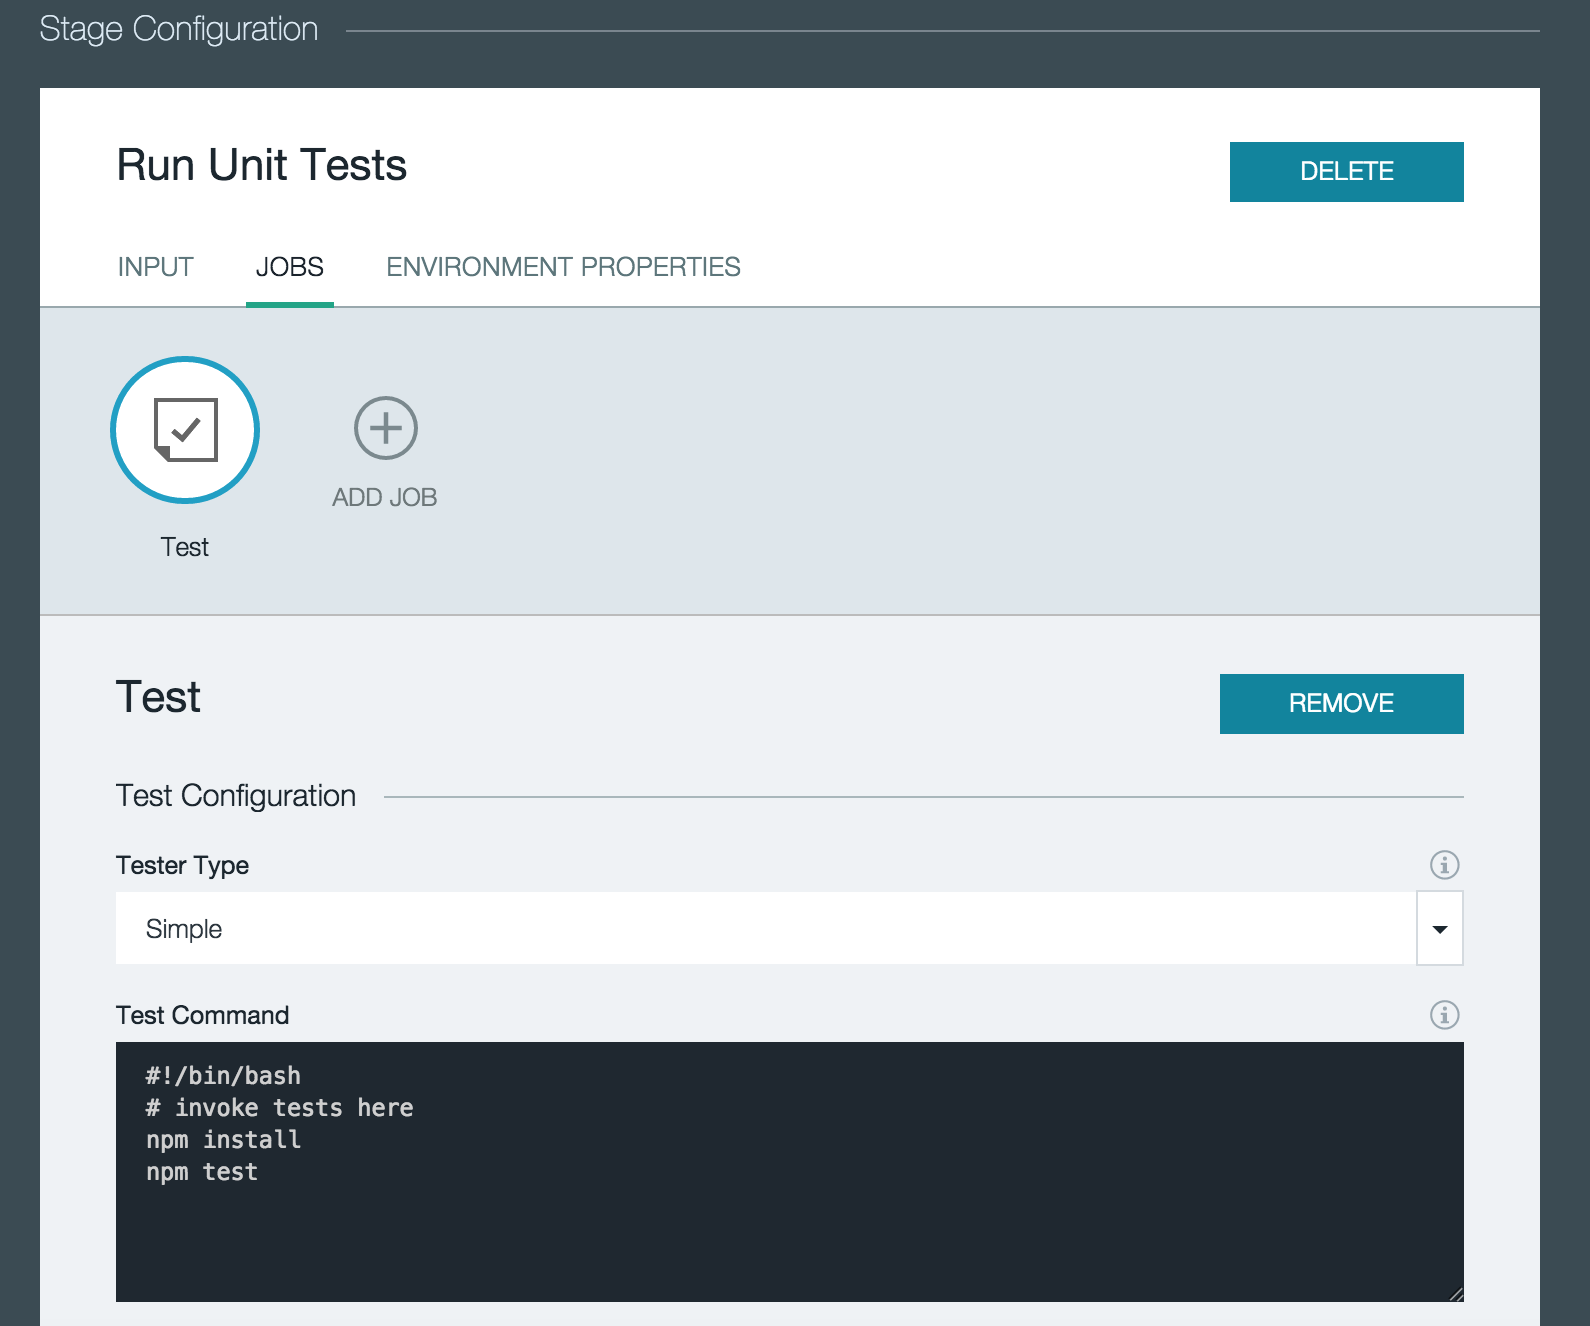
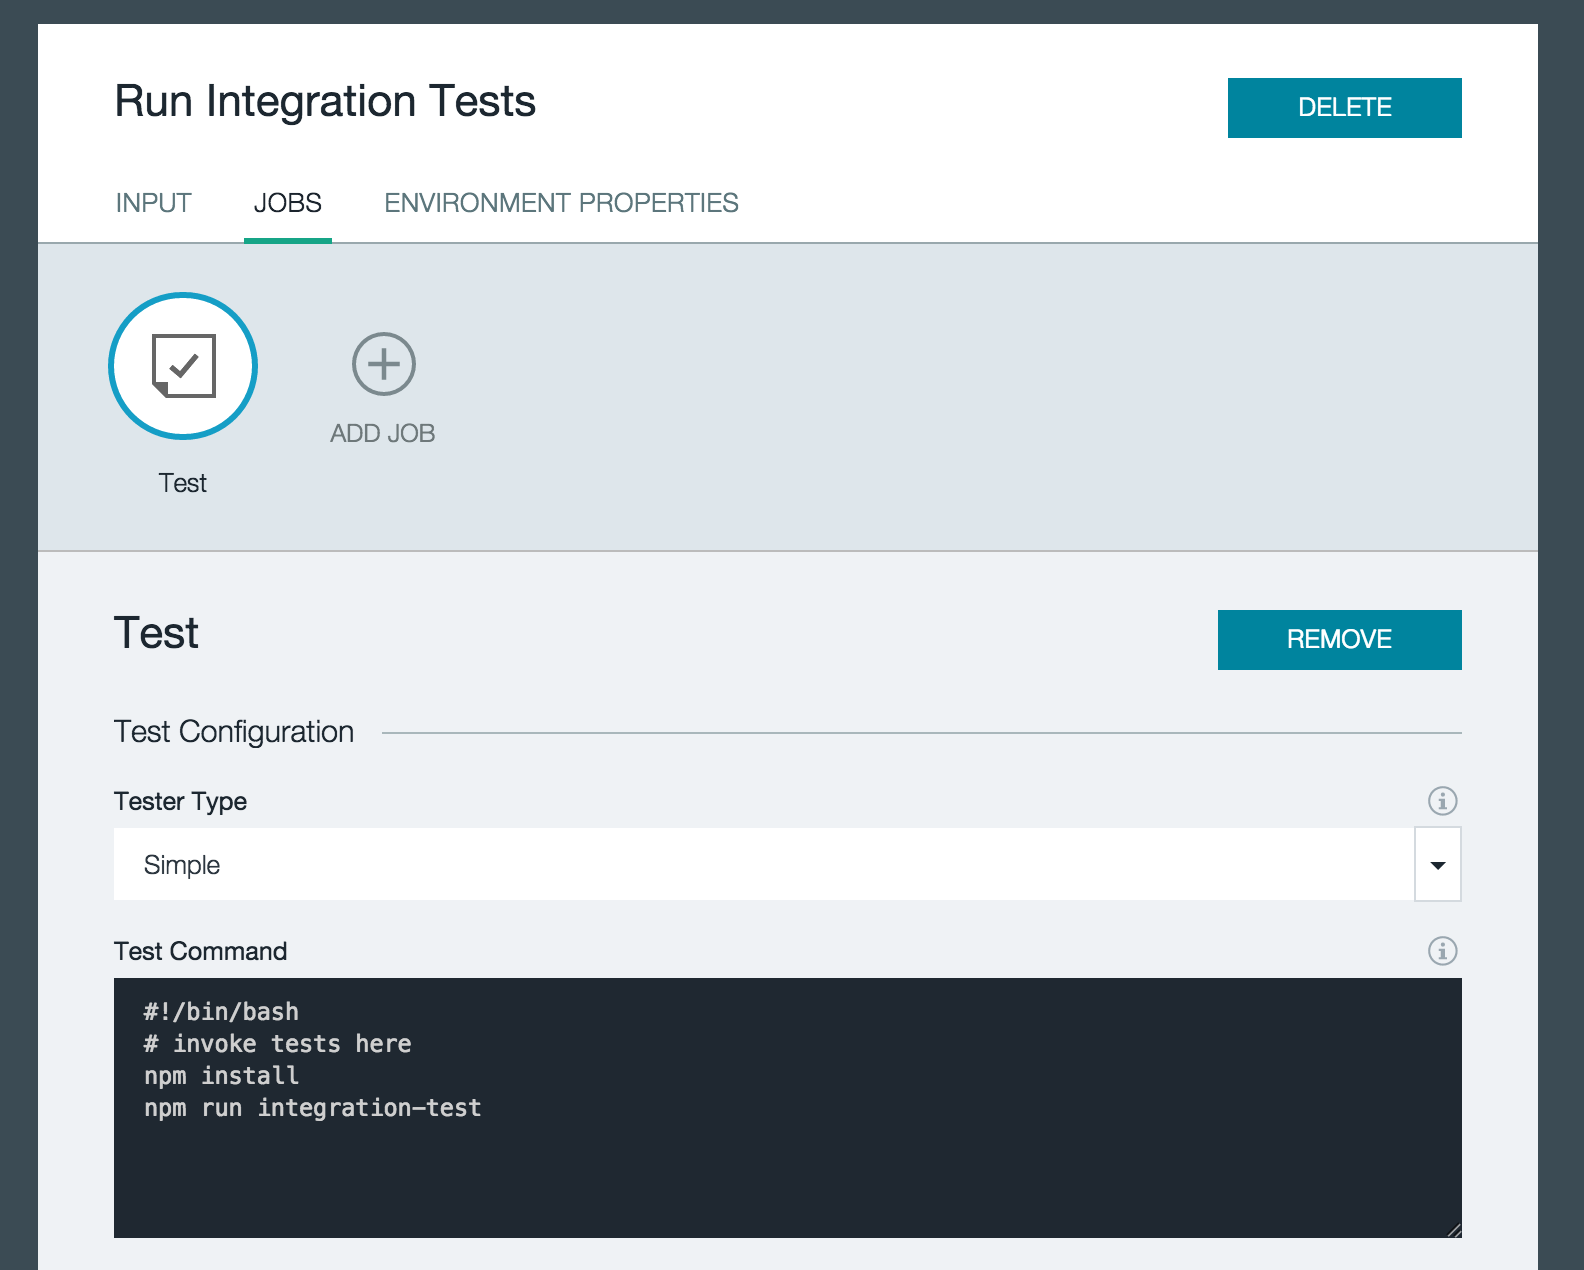
On the “Jobs” tab, we can configure multiple tasks to be executed when triggered by the stage input. For the unit tests, we’re using a simple shell script to install the project dependencies and run the NPM task.

Deploy Test Server

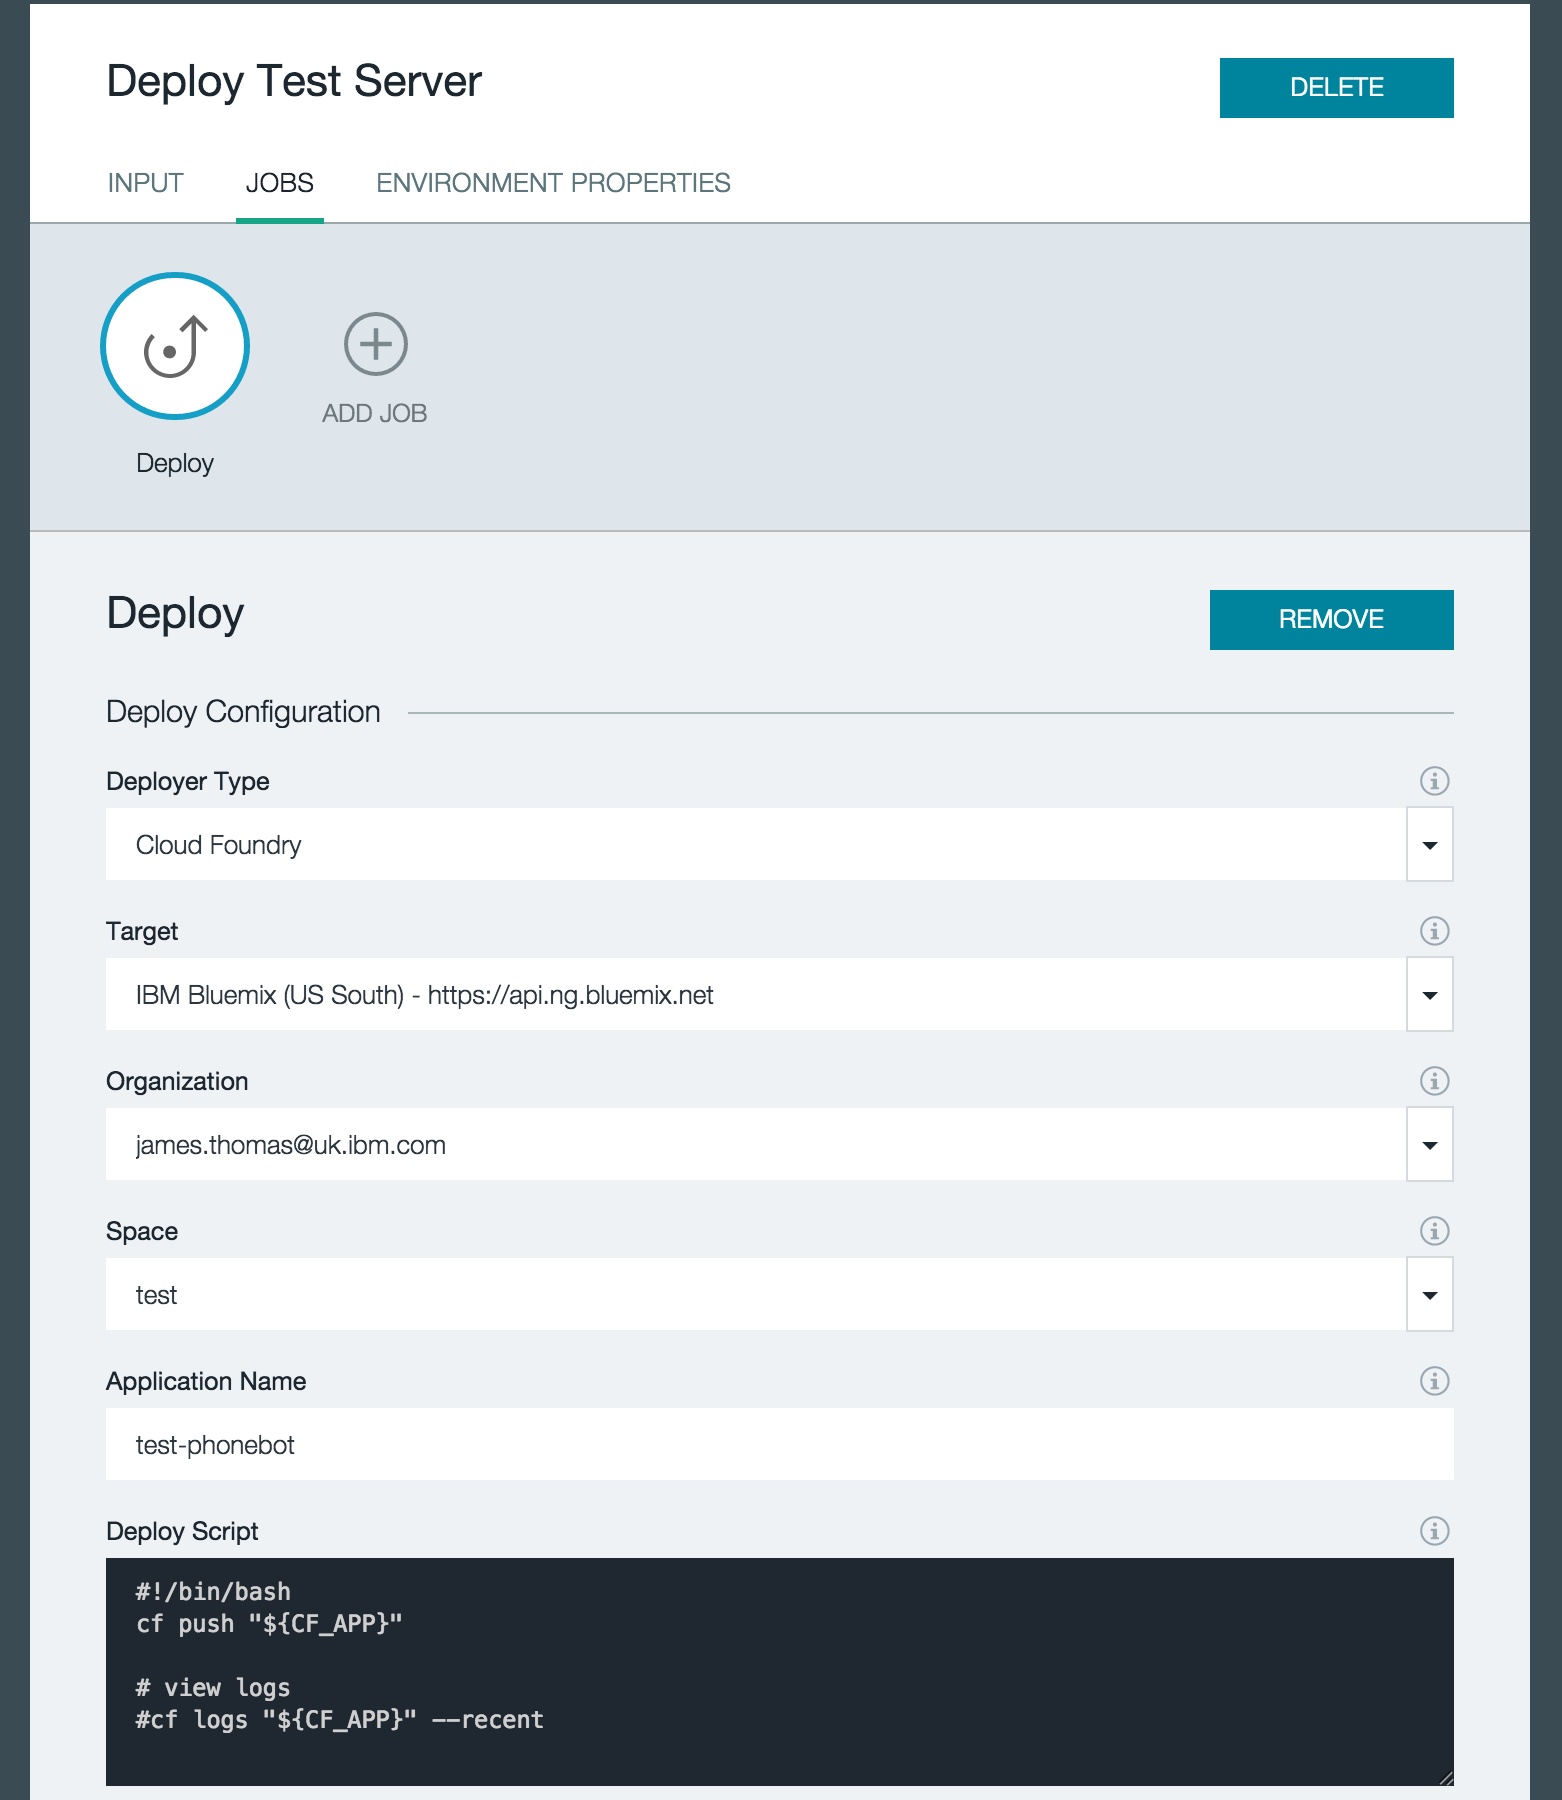
Adding a second stage to the pipeline after the unit tests, we will use it to deploy our test server. This stage will only be executed if the first stage completes successfully.

Using the “Deploy” rather than “Test” job, presents us with a configuration panel to set up the deployment parameters. The “test” space which contains our test configuration for our mock services. Choosing a different application name means our test server won’t clash with the existing production host already deployed.

Running Integration Tests Against Test Server

Once the test server has been deployed, we can trigger the pipeline stage to run integration tests against this host.

Using Mocha to run out integration tests means we can follow the setup as the unit test stage. Defining a “test” job, we install the project dependencies and then run the test harness.

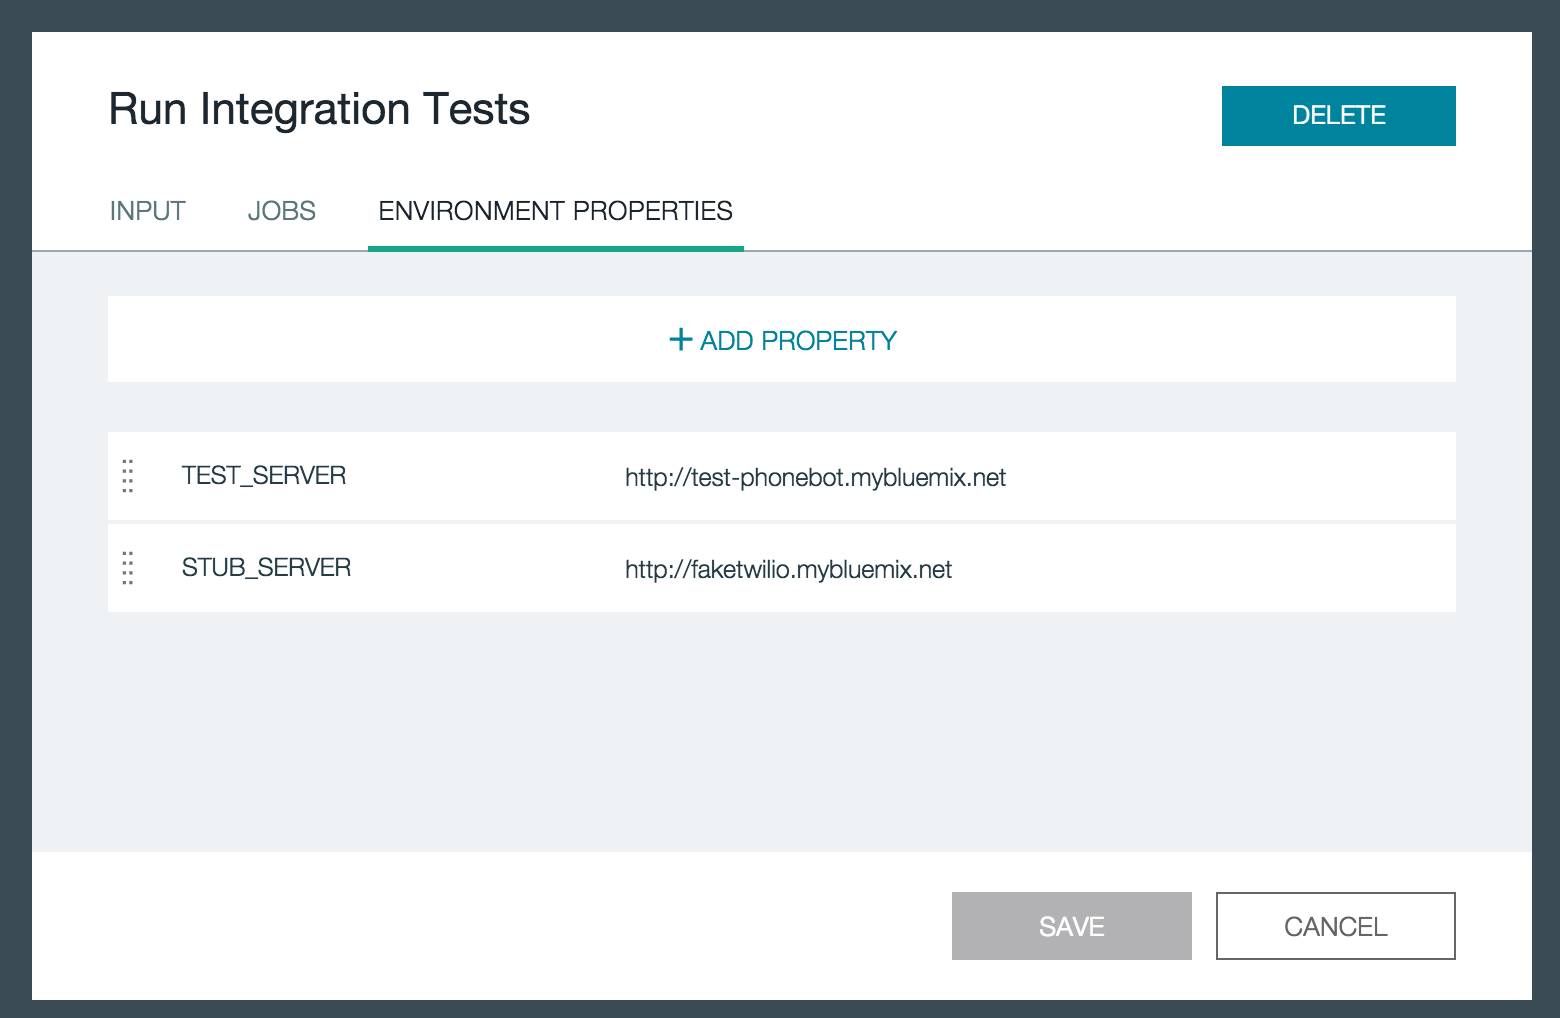
Phonebot’s integration tests use environment variables to define the test and stub server locations. We can define these through the stage setup page, as shown below.

Deploy To Production

Finally, provided all the previous stages were successfully, the last stage will deploy our application into production.

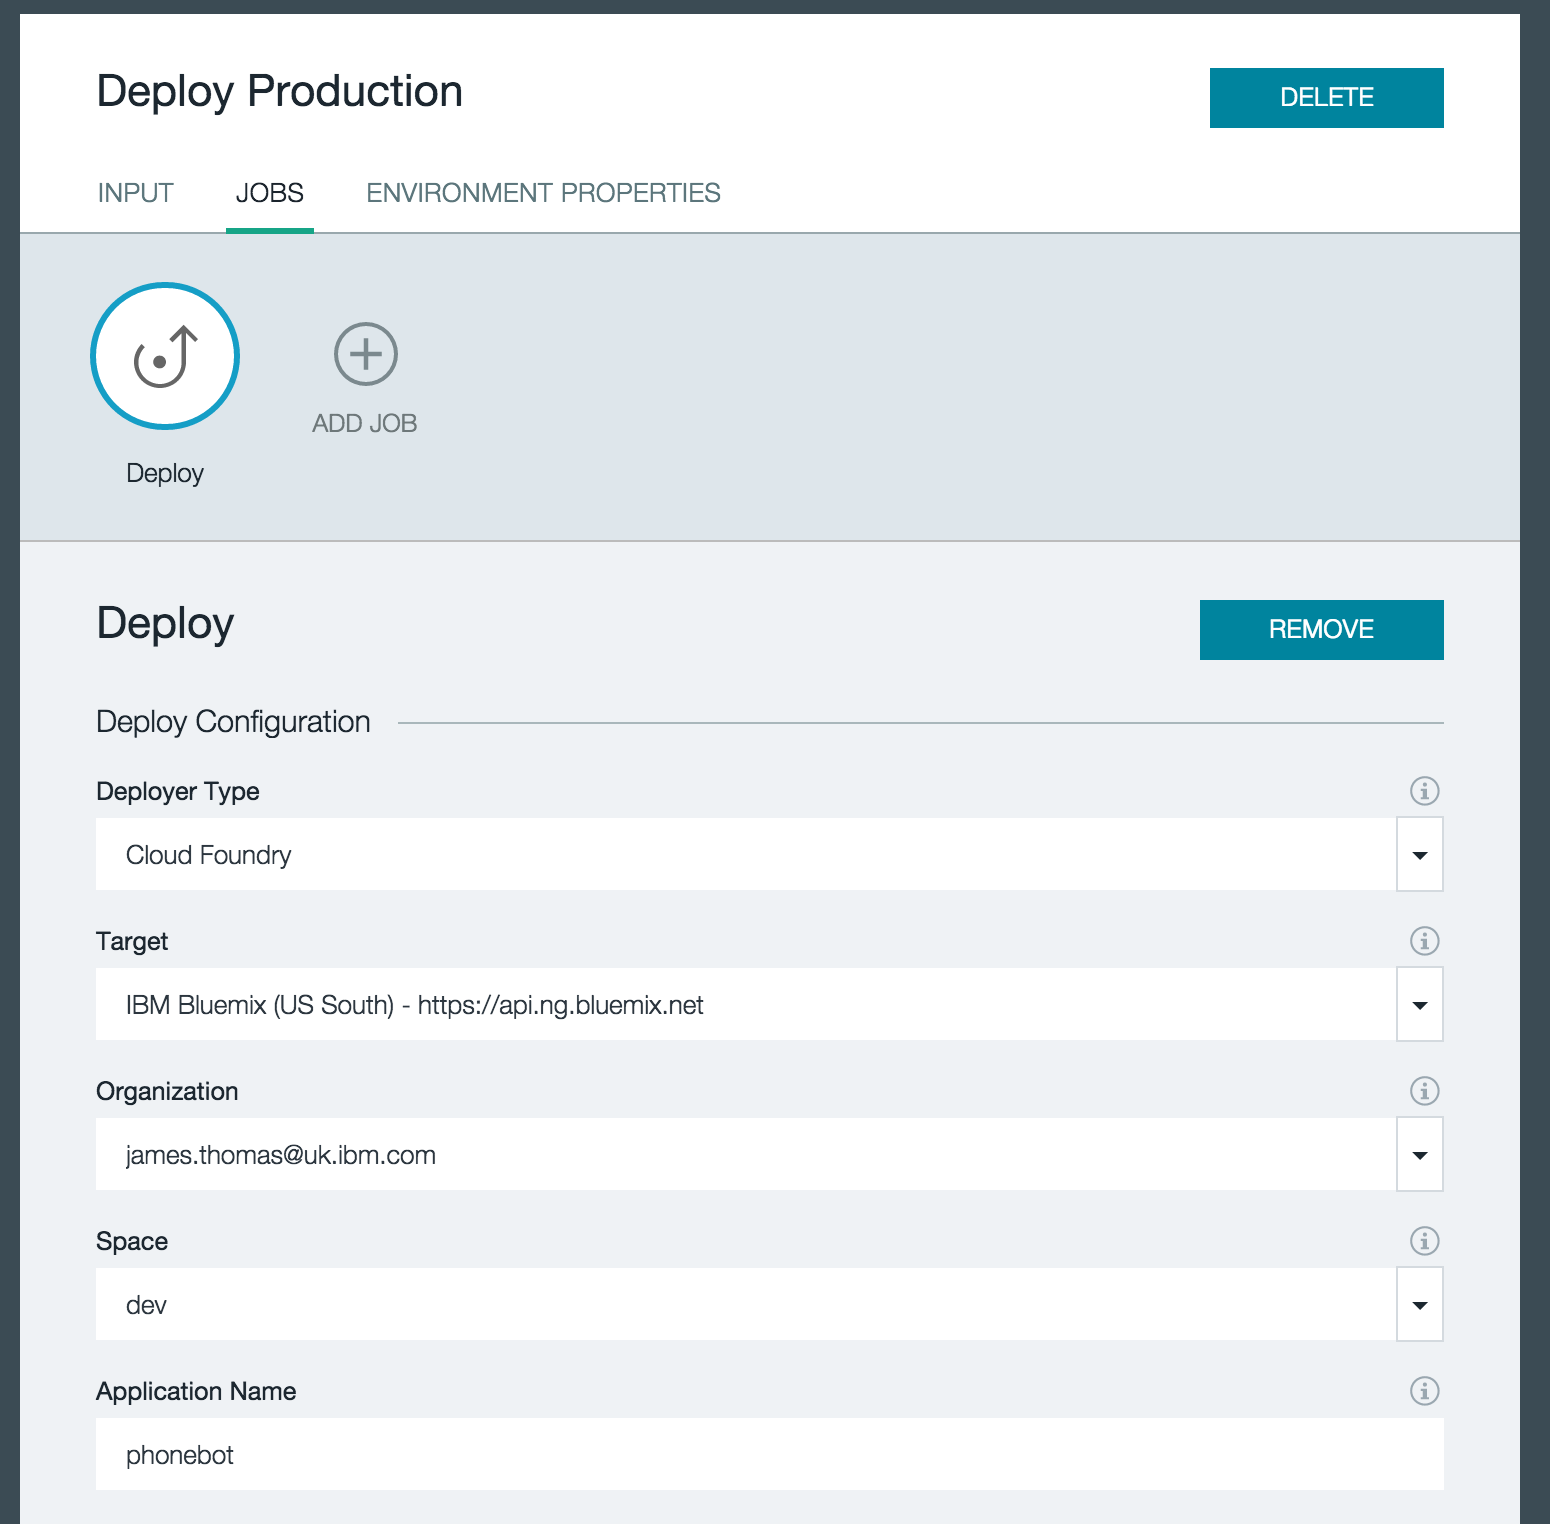
Configuring a “Deploy” task, this time we use the production space “dev” and use the proper application name.

…and that’s it!

With our “Continuous Delivery” pipeline now configured, new versions of Phonebot will be automatically deployed to production without any manual work.

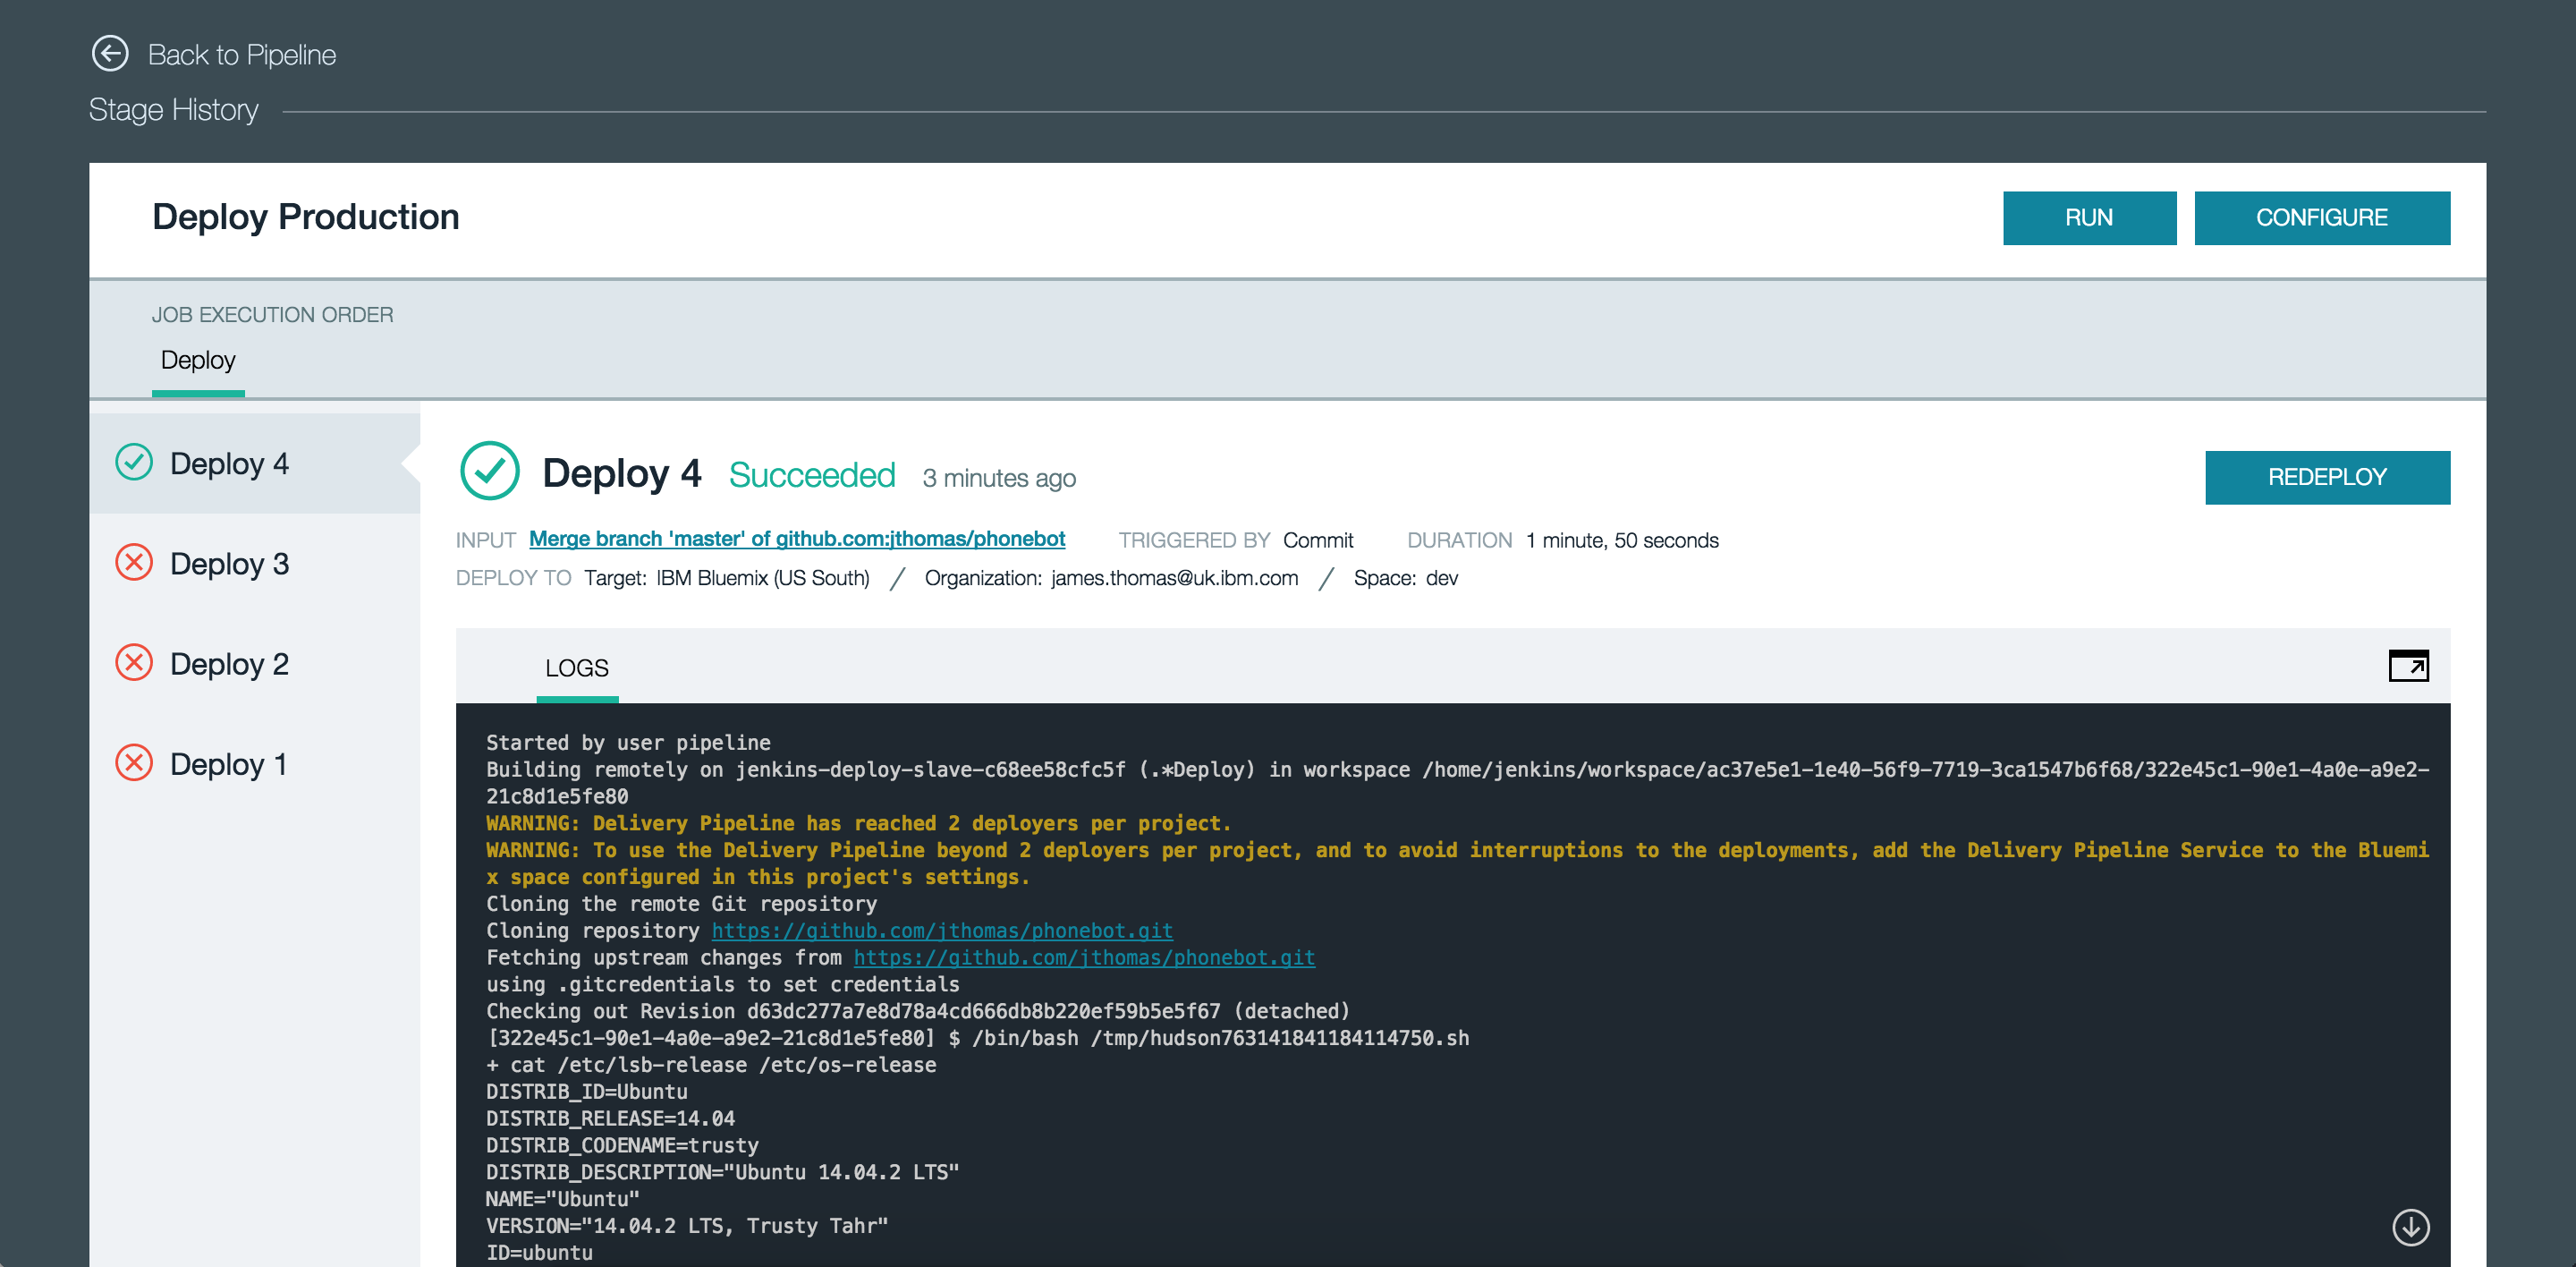
For testing, each stage can be triggered manually. Logs are available in to diagnose any issues that may occur.

Using IBM DevOps Services, we rapidly created a build and deploy pipeline linked to a project on Github without having to manually configure build systems, test servers or anything else you would expect.

Our example was relatively simple, the service can be configured for far more complicated build and deploy tasks. The documentation gives full details on the capabilities of that platform. If you have any issues, please use the IBM Answers support forum to post questions and get answers from the development team.

Phonebot

Last month, a colleague was explaining he was not looking forward to an afternoon of long-distance conference calls. Having recently started using Slack for collaboration with their remote team, they lamented…

I wish I could do my conference calls using Slack!

…which got us thinking.

Recent experiments with IBM Watson Speech To Text and Twilio on IBM Bluemix had shown how easy it was to create telephony applications. Slack publishes multiple APIs to help developers build custom “bots” that respond to channel content.

Could we create a new Slackbot that let users make phone calls using channel messages?

One month later, Phonebot was born!

Slackbot that lets users make phone calls within a Slack channel.
Users can dial a phone number, with the phone call audio converted to text and sent to the channel.
Channel message replies are converted to speech and sent over the phone call.

tl;dr Full source code for the project is available here. Follow the deployment instructions to run your own version.

Read on to find out how we put IBM Watson, Twilio and IBM Bluemix to develop our custom Slackbot…

Custom Slackbots

Slack publishes numerous APIs for integrating custom services. These APIs provide everything from sending simple messages as Slackbot to creating a real-time messaging service.

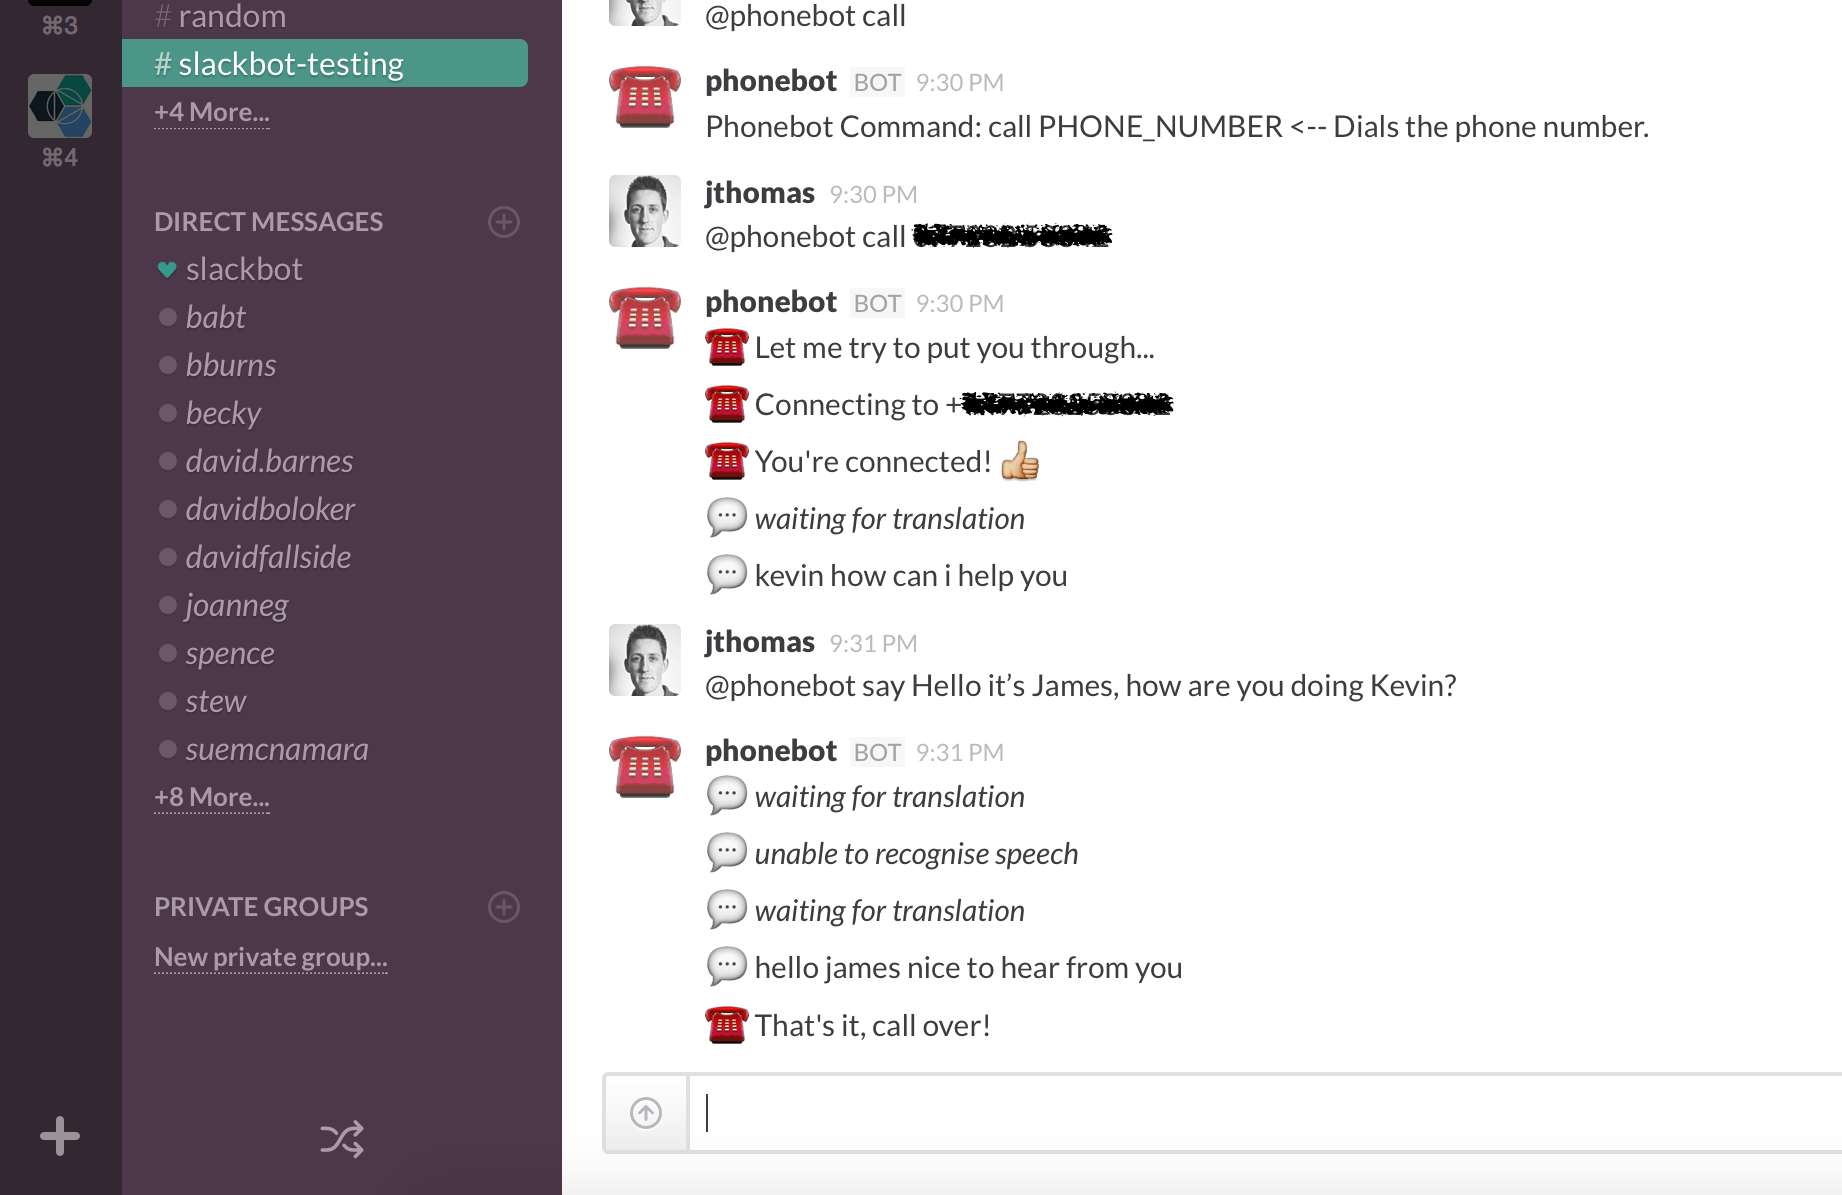
Phonebot will listen to messages starting with @phonebot and which contain user commands e.g. dial, hangup. It will create new channel messages with the translated speech results along with status messages. Users can issue the following commands to control Phonebot.

1
2
3
4
5
6
@phonebot call PHONE_NUMBER <-- Dials the phone number
@phonebot say TEXT <-- Sends text as speech to the call 
@phonebot hangup <-- Ends the active call
@phonebot verbose {on|off}<-- Toggle verbose mode
@phonebot duration NUMBER <-- Set recording duration
@phonebot help <-- Show all commands usage information 

We use the Incoming Webhooks API to post new channel messages and the Outgoing Webhook API to notify the application about custom channel commands.

Listening for custom commands

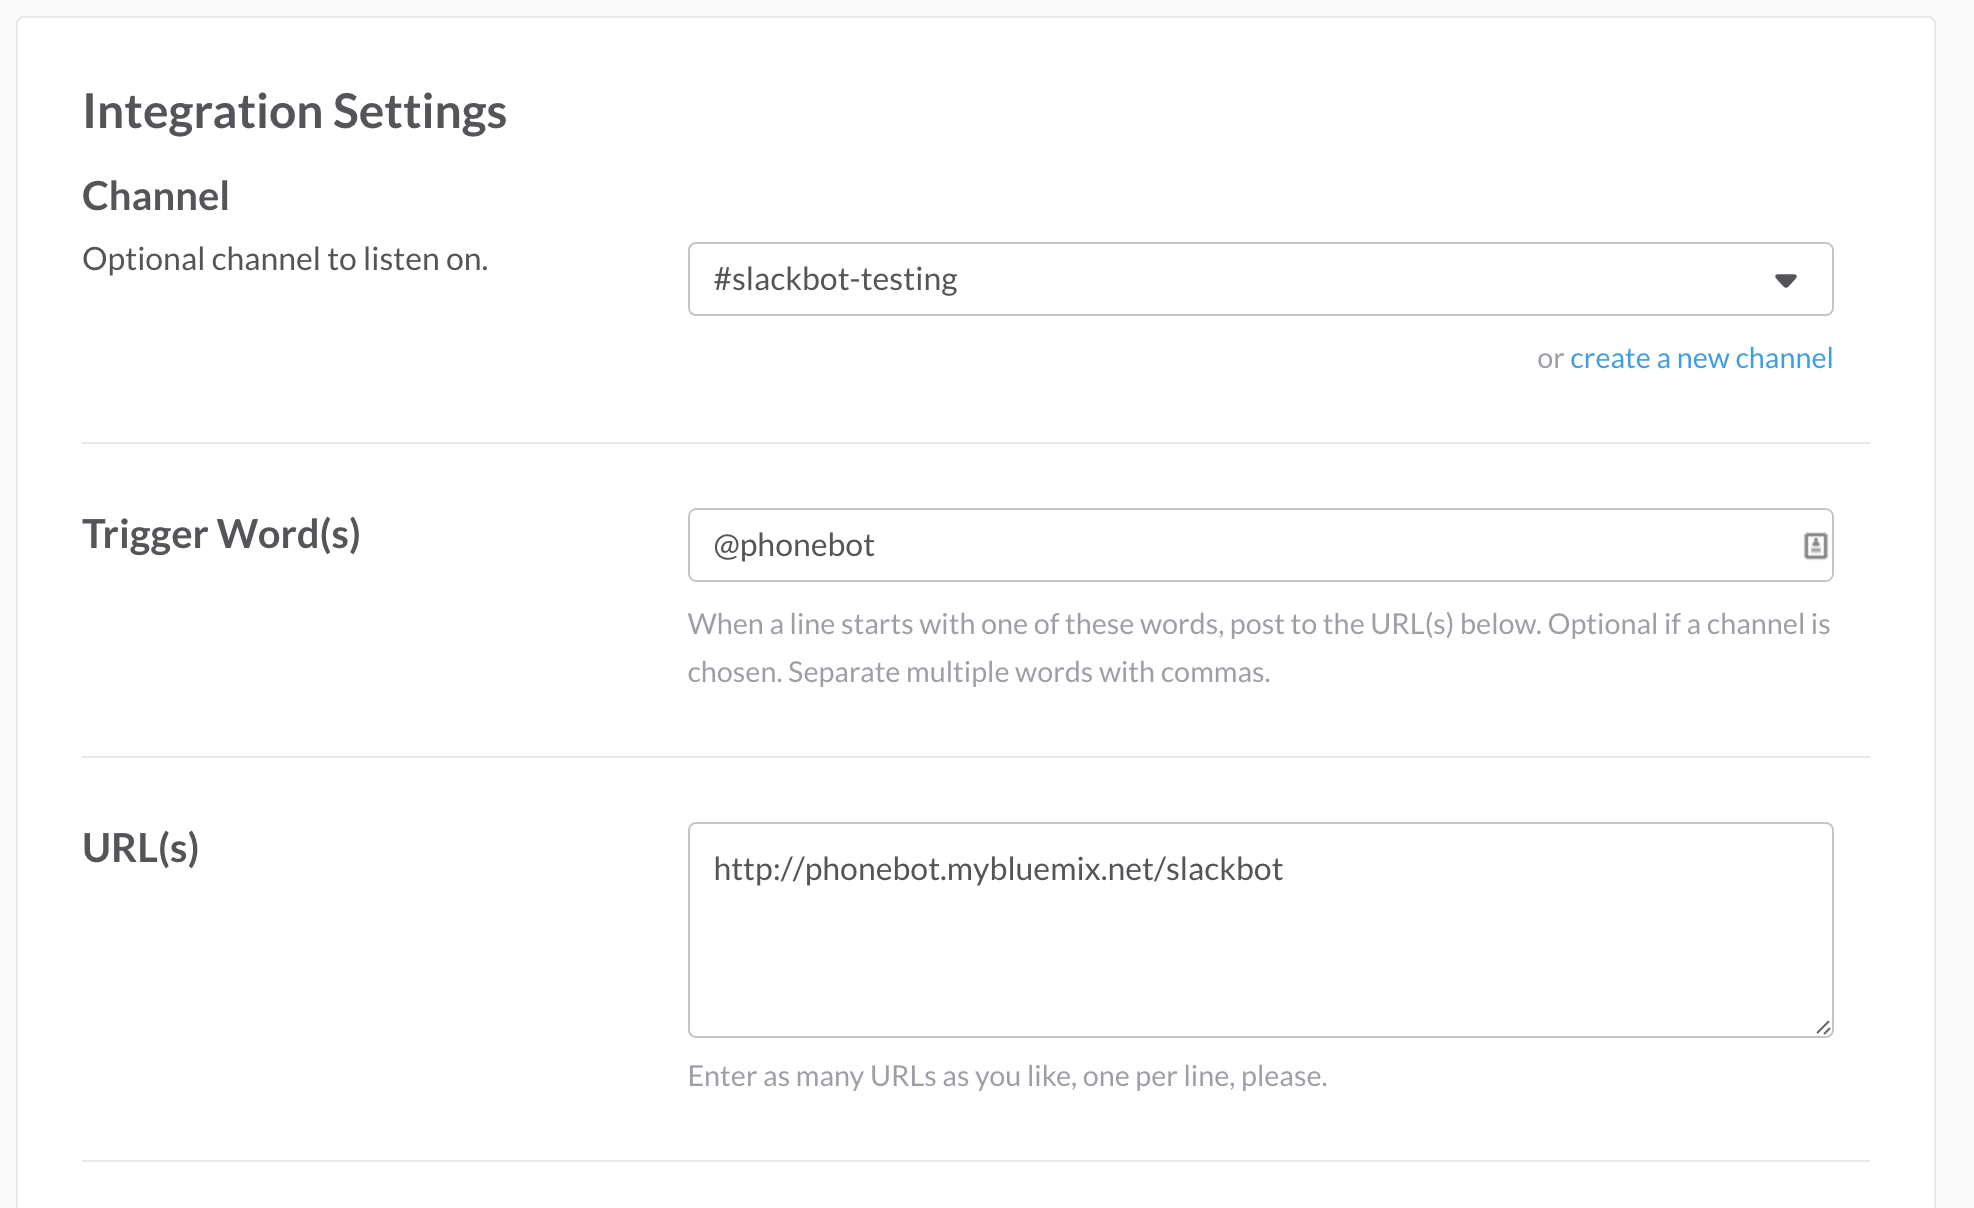
Creating a new Outgoing Webhook, messages from the registered channels which begin with the “@phonebot” prefix will be posted to HTTP URL for the IBM Bluemix application handling the incoming messages.

We can create Outgoing Webhooks for every channel we want to register Phonebot in.

For each registered channel, we need to allow Phonebot to post new messages.

Sending new channel messages

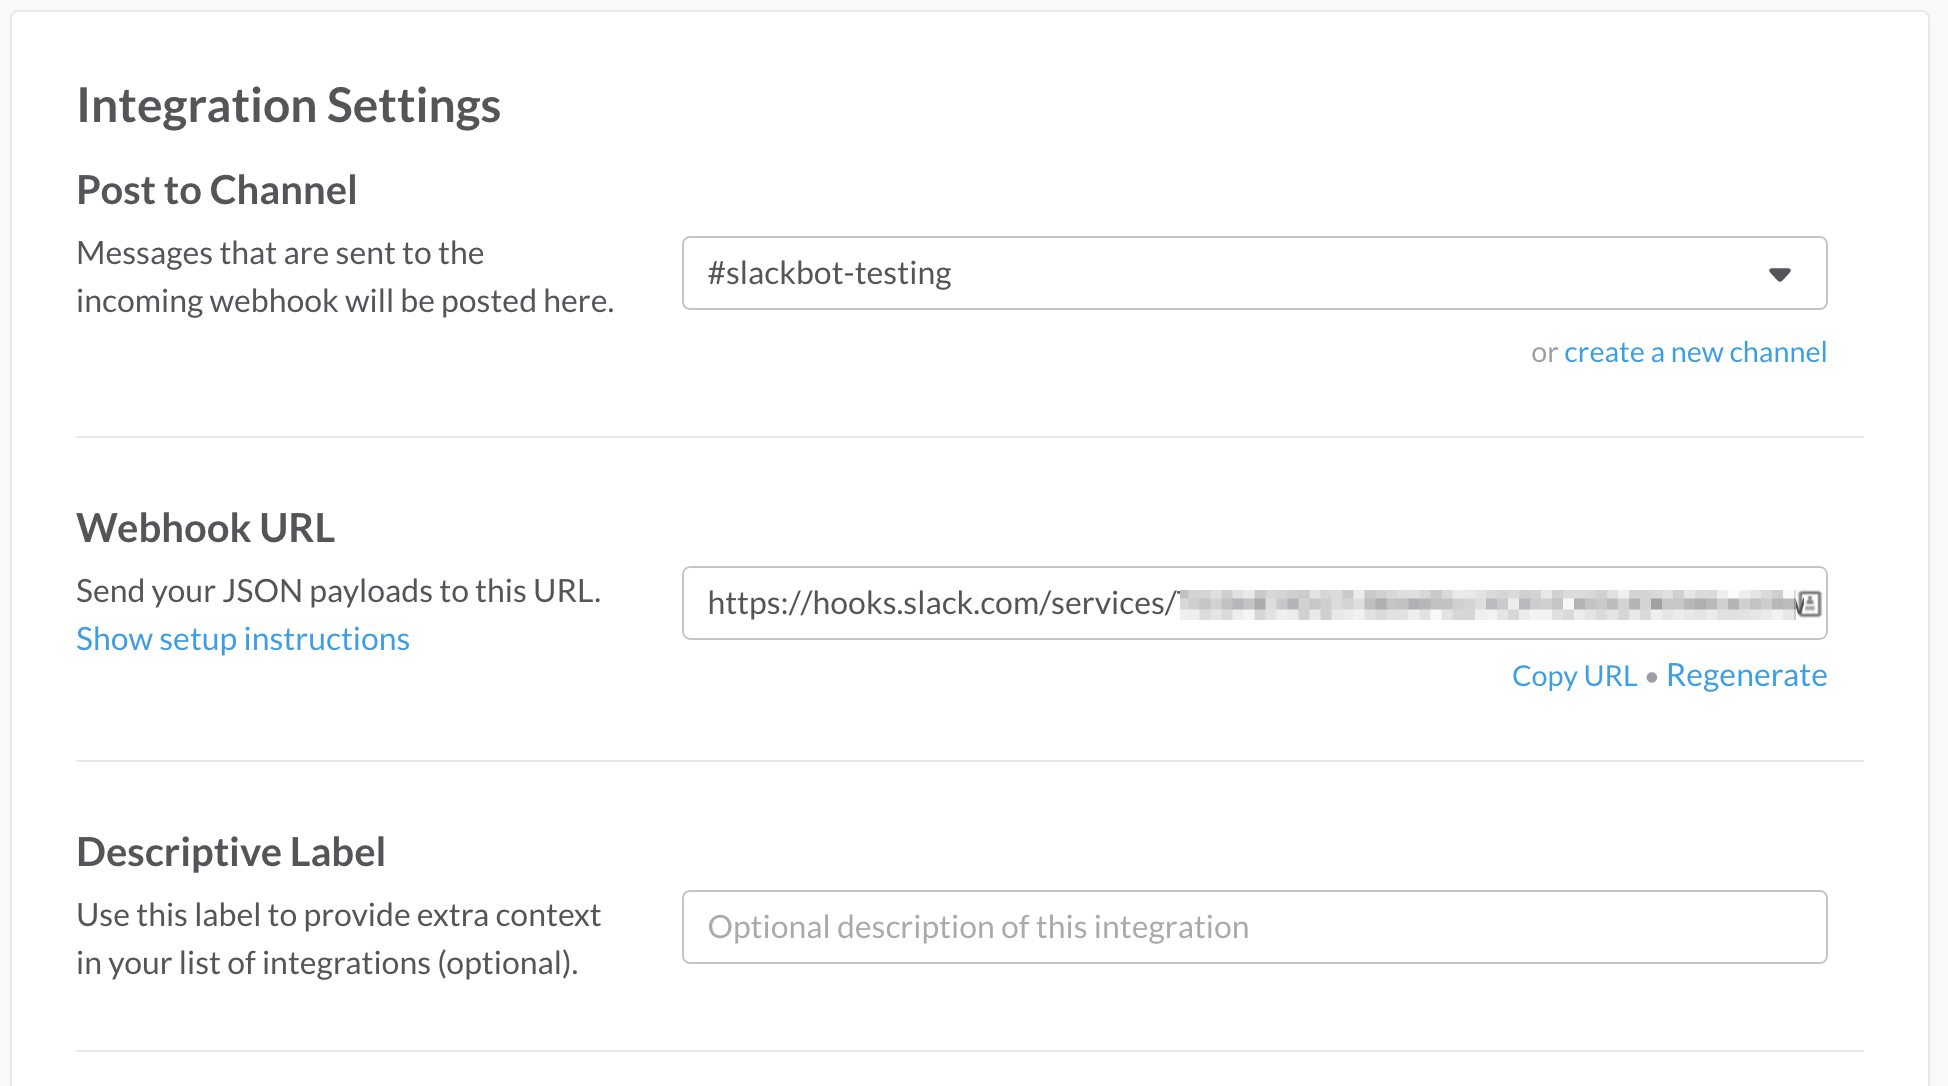
Incoming Webhooks provide an obfuscated HTTP URL that allows unauthenticated HTTP requests to create new channel messages. Creating a new Incoming obfuscated for each channel we are listening to will allow Phonebot to post responses.

Each Incoming Webhook URL will be passed to Phonebot application using configuration via environment variables.

Making Phone Calls

Twilio provides “telephony-as-a-service”, allowing applications to make telephone calls using a REST API.

Twilio has been made available on the IBM Bluemix platform. Binding this service to your application will provide the authentication credentials to use with the Twilio client library.

When users issue the “call” command with a phone number, the channel bot listening to user commands emits a custom event.

1
2
3
4
5
6
7
8
9
10
bot.on('call', function (number) {
  var phone = this.channels[channel].phone

  if (phone.call_active()) {
    bot.post('The line is busy, you have to hang up first...!')
    return
  }

  phone.call(number, this.base_url + '/' + channel)
})

Within the “phone” object, the “call” method triggers the following code.

1
2
3
4
5
6
7
8
9
10
11
12
this.client.makeCall({
  to: number,
  from: this.from,
  url: route
}, function (err, responseData) {
  if (err) {
    that.request_fail('Failed To Start Call: ' + number + '(' + route + ') ', err)
    return
  }

  that.request_success('New Call Started: ' + number + ' (' + route + '): ' + responseData.sid, responseData)
})

The URL parameter provides a HTTP URL which Twilio will use to POST updated call status information. HTTP responses from this location will tell Twilio how to handle the ongoing call, e.g. play an audio message, press the following digits, record phone line audio.

If the phone call connects successfully, we need the phone line audio stream to translate the speech into text. Unfortunately, Twilio does not support directly accessing the real-time audio stream. However, can record a batch of audio, i.e five seconds, and download the resulting file.

Therefore, we will tell Twilio to record a short section of audio and post the results back to our application. When this message is received, our response will contain the request to record another five seconds. This approach will provide a semi-realtime stream of phone call audio for processing.

Here is the code snippet to construct the TwiML response to record the audio snippet. Any channel messages that are queued for sending as speech will be added to the outgoing response.

1
2
3
4
5
6
7
8
9
10
twiml = new twilio.TwimlResponse()

// Do we have text to send down the active call?
if (this.outgoing.length) {
  var user_speech = this.outgoing.join(' ')
    this.outgoing = []
    twiml.say(user_speech)
}

twiml.record({playBeep: false, trim: 'do-not-trim', maxLength: this.defaults.duration, timeout: 60})

When we have the audio files containing the phone call audio, we can schedule these for translation with the IBM Watson Speech To Text service.

Translating Speech To Text

Using the IBM Watson Speech To Text service, we can simply transcribe phone calls by posting the audio file to the REST API. Using the client library handles making the actual API requests behind a simple JavaScript interface.

1
2
3
4
5
6
7
8
9
10
11
12
13
14
15
16
17
18
19
var params = {
  audio: fs.createReadStream(file_name),
  content_type: 'audio/l16; rate=16000'
}

this.speech_to_text.recognize(params, function (err, res) {
  if (err) {
    this.error(err)
    return
  }

  var result = res.results[res.result_index]
  if (result) {
    this.transcript = result.alternatives[0].transcript
    this.emit('available')
  } else {
    this.error('Missing speech recognition result.')
  }
})

Having previously handling converting the audio file from the format created by Twilio to that needed by the Watson API, we were able to reuse the translate.js class between projects.

This module relies on the SOX library being installed in the native runtime. We used a custom buildpack to support this.

Managing Translation Tasks

When a new Twilio message with audio recording details is received, we schedule a translation request. As this background task returns, the results are posted into the corresponding Slack channel.

If a translation request takes longer than expected, additional requests may be scheduled before the first has finished. We still want to maintain the order when posting new channel messages, even if later requests finishing translating first.

Using the async library, a single-worker queue is created to schedule the translation tasks.

Each time the phone object for a channel emits a ‘recording’ event, we start the translation request and post the worker to the channel queue.

1
2
3
4
5
6
7
8
phone.on('recording', function (location) {
  if (phone.defaults.verbose) {
    this.channels[channel].bot.post(':speech_balloon: _waiting for translation_')
  }
  var req = translate(this.watson, location)
  req.start()
  this.channels[channel].queue.push(req)
})

When a task reaches the front of the queue, the worker function is called to process the result.

If translation task has finished, we signal to the queue this task has completed. Otherwise, we wait for completion events being emitted.

1
2
3
4
5
6
7
8
9
10
11
12
13
14
15
16
17
18
19
20
21
var queue = async.queue(function (task, callback) {
  var done = function (message) {
    if (message) this.channels[channel].bot.post(':speech_balloon: ' + message)
    callback()
    return true
  }

  var process = function () {
    return done(task.transcript)
  }

  var failed = function () {
    return done(this.channels[channel].phone.defaults.verbose ? '_unable to recognise speech_' : '')
  }

  if (task.transcript && process()) return
  if (task.failed && failed()) return

  task.on('available', process)
  task.on('failed', failed)
}, 1)

Deploying Phonebot

Now we’ve finished the code, we can configure the application to deploy on the IBM Bluemix cloud platform.

Configuring Webhooks

Phonebot must be passed the configured incoming webhooks URLs, allowing it to send channel messages. Following the standard Platform-as-a-Service convention for passing configuration, we store the channel webhooks as environment variables.

Using the CF CLI, we run the following command to set up the local environment parameters.

1
$ cf cups slack_webhooks -p '{"channel_name":"incoming_webhook_url",...}'

Application Manifest

Application manifests configure deployment parameters for Cloud Foundry applications. Phonebot will need to be bound to Twilio, IBM watson and custom services, along with configuring the runtime environment.

---
applications:
- name: phonebot 
  memory: 256M 
  command: node app.js
  buildpack: https://github.com/jthomas/nodejs-buildpack.git
  services:
  - twilio
  - speech_to_text
  - slack_webhooks
declared-services:
  twilio:
    label: Twilio
    plan: 'user-provided'
  twilio:
    label: slack_webhooks
    plan: 'user-provided'
  speech_to_text:
    label: speech_to_text
    plan: free

…with this manifest, we can just use the cf push command to deploy our application!

Using Phonebot

Phonebot will post the following message to each channel successfully registered on startup.

Users can issue @phonebot COMMAND messages to control phone calls directly from the slack channel.

For further information about the project, follow the project on Github. Upcoming features are listed in the issues page. Please feel free to ask for new features, report bugs and leave feedback on Github.

IBM Watson Nodes for Node-RED

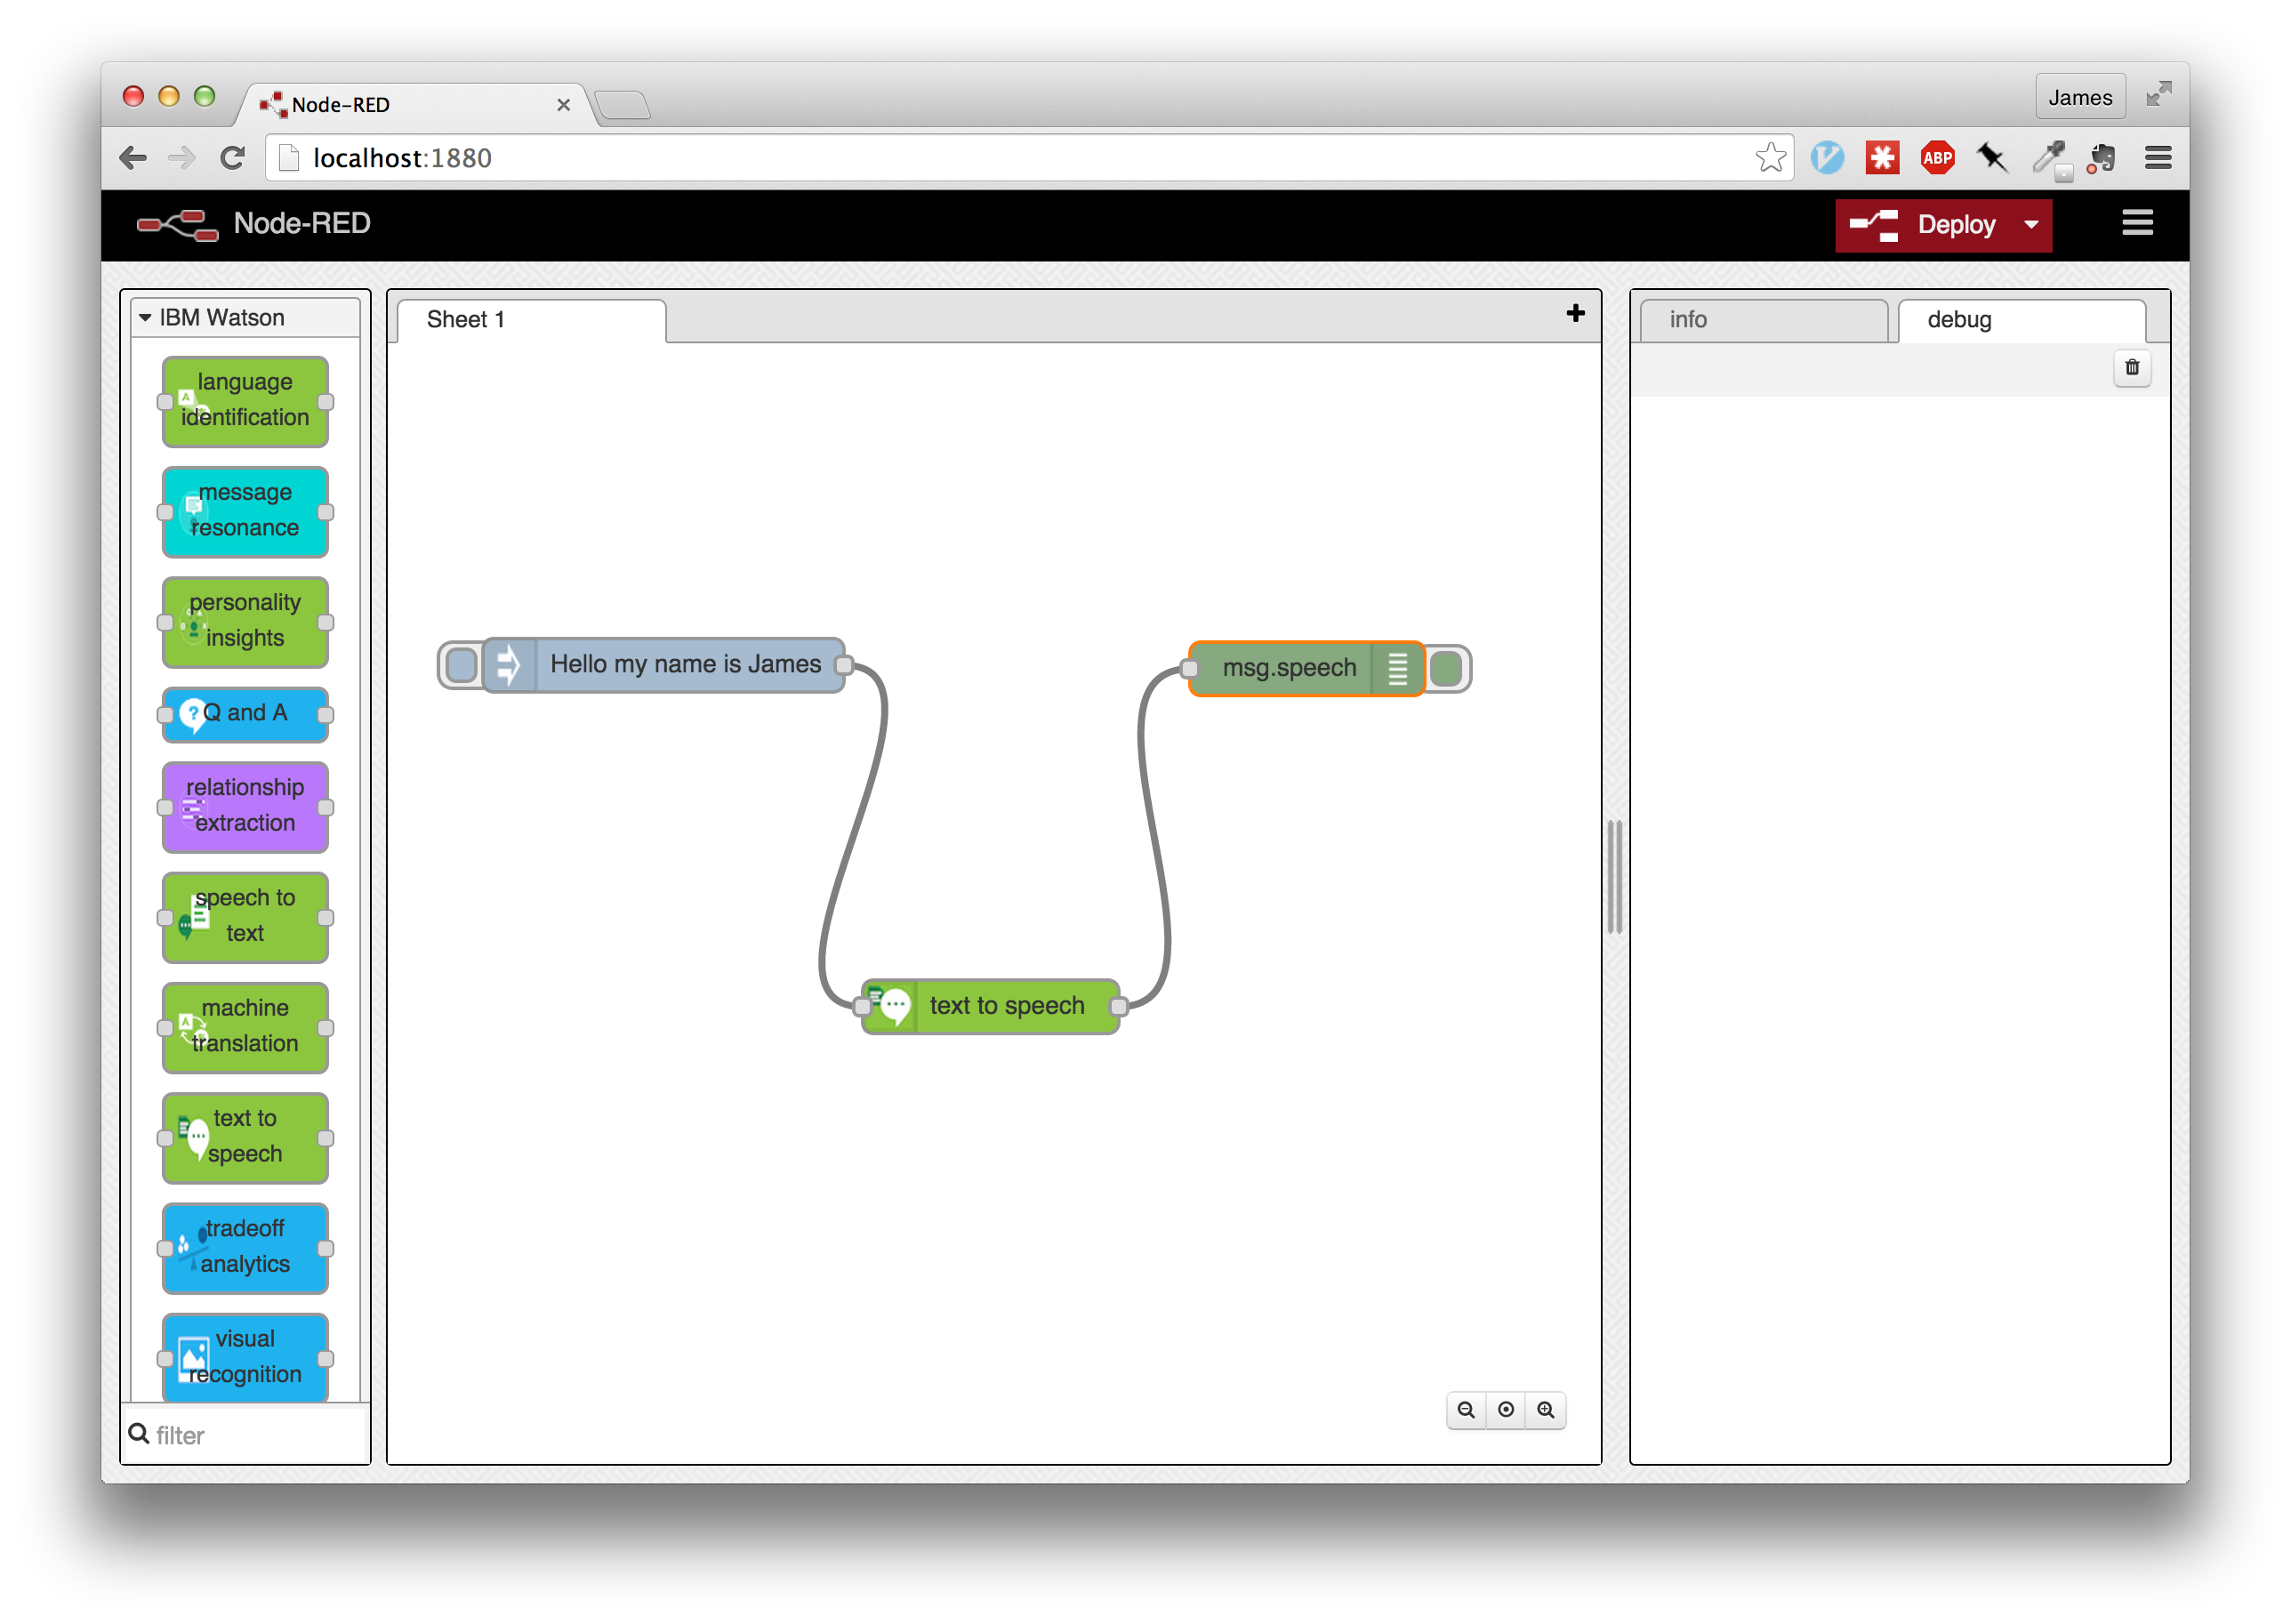
I’ve updated the IBM Watson Nodes for Node-RED to include seven extra services.

Previously, the package only provided support for the following services:

  • Language Identification.
  • Machine Translation.
  • Question & Answers.

With the recent code changes, users now have access to the additional services:

  • Message Resonance.
  • Personality Insights.
  • Relationship Extraction.
  • Speech to Text.
  • Text to Speech.
  • Tradeoff Analytics.
  • Visual Recognition.

Using Node-RED through the IBM Bluemix boilerplate will automatically include the IBM Watson modules in the palette.

It is possible to use the IBM Watson nodes with Node-RED outside of IBM Bluemix provided you have the local environment variables configured to provide the service credentials.

For information about the individual services, please see the IBM Watson Developer Cloud.

Creating CF CLI Plugins

Since the v.6.7 release of the Cloud Foundry Command Line Interface (CF CLI), users have been to create and install plugins to provide custom commands.

There’s now a whole community of third-party plugins to help make you more productive developing Cloud Foundry applications.

Installing Plugins

Plugins can be installed directly from the platform binary.

1
2
$ go get github.com/sample_user/sample_plugin
$ cf install-plugin $GOPATH/bin/sample_plugin

…or discovered and installed directly from plugin repositories.

1
2
3
4
5
6
7
8
9
10
11
12
13
14
15
16
17
18
19
20
21
22
$ cf add-plugin-repo cf-plugins http://plugins.cloudfoundry.org/
$ cf list-plugin-repos
OK

Repo Name    Url
cf-plugins   http://plugins.cloudfoundry.org/

$ cf repo-plugins
Getting plugins from all repositories ...

Repository: cf-plugins
name                   version   description
CLI-Recorder           1.0.1     Records and playbacks CLI commands.
Live Stats             1.0.0     Monitor CPU and Memory usage on an app via the browser.
Console                1.0.0     Start a tmate session on an application container
Diego-Beta             1.3.0     Enables Diego-specific commands and functionality
Open                   1.1.0     Open app url in browser
autopilot              0.0.1     zero downtime deploy plugin for cf applications
Brooklyn               0.1.1     Interact with Service Broker for Apache Brooklyn
kibana-me-logs         0.3.0     Launches the Kibana UI (from kibana-me-logs) for an application.
Buildpack Usage        1.0.0     View all buildpacks used in the current CLI target context.
CF App Stack Changer   1.0.0     Allows admins to list and update applications with outdated lucid64 stacks.

Once a repository has been registered, we can search and install the available plugins.

1
2
3
4
5
6
7
8
9
10
11
12
13
14
15
16
17
18
19
20
$ cf install-plugin open -r cf-plugins
Looking up 'open' from repository 'cf-plugins'
  7998292 bytes downloaded...
Installing plugin /var/folders/db/9y12sh3n0kdg4v3zxnn8dbg80000gn/T/ filename=cf-plugin-open_darwin_amd64...
OK
Plugin open v1.1.0 successfully installed.

$ cf plugins
Listing Installed Plugins...
OK

Plugin Name   Version   Command Name   Command Help
open          1.1.0     open           open app url in browser

$ cf open
NAME:
   open - open app url in browser

USAGE:
   open <appname>

How about creating your own plugins? Here I’ll show you how by walking through the steps used to create my first plugin, copyenv.

Creating New Plugins

Plugins are Go binaries, implenting a common interface defined by the CF CLI project.

There’s a Run() function to implement that acts as a callback when the user issues the plugin command along with a GetMetadata() function to provide the metadata for the new command.

There’s a list of example plugins to start with in the CF CLI repository.

For our plugin, we’re starting with the basic_plugin code. This file contains a skeleton outline for a basic plugin implementation that you can modify.

Plugin Structure

Reviewing the basic_plugin example, plugins follow a simple structure.

First, we declare the Go package “main” as this code will be compiled into an executable command. Application dependencies are registered with the “import” definition. We link to the CF CLI Plugin package to access the common interface that defines a runnable plugin. BasicPlugin is the name of our struct that will implement the Plugin Interface.

1
2
3
4
5
6
7
8
package main

import (
  "fmt"
  "github.com/cloudfoundry/cli/plugin"
)

type BasicPlugin struct{}

The “Run” function will be executed each time a user calls our custom plugin command. We are passed a reference to the CF CLI, for running additional commands, along with the command line arguments.

1
2
3
4
5
6
func (c *BasicPlugin) Run(cliConnection plugin.CliConnection, args []string) {
  // Ensure that we called the command basic-plugin-command
  if args[0] == "basic-plugin-command" {
    fmt.Println("Running the basic-plugin-command")
  }
}

Returning metadata to install the plugin is implemented via the “GetMetadata” function. We can specify the plugin version number, help documentation and command identifiers.

1
2
3
4
5
6
7
8
9
10
11
12
13
14
15
16
17
18
19
20
21
22
func (c *BasicPlugin) GetMetadata() plugin.PluginMetadata {
  return plugin.PluginMetadata{
    Name: "MyBasicPlugin",
    Version: plugin.VersionType{
      Major: 1,
      Minor: 0,
      Build: 0,
    },
    Commands: []plugin.Command{
      plugin.Command{
        Name:     "basic-plugin-command",
        HelpText: "Basic plugin command's help text",

        // UsageDetails is optional
        // It is used to show help of usage of each command
        UsageDetails: plugin.Usage{
          Usage: "basic-plugin-command\n   cf basic-plugin-command",
        },
      },
    },
  }
}

Finally, the “main” function will the entry point when executing the compiled binary. Calling “plugin.Start” with a pointer to the struct implementing the Plugin interace will register our plugin.

1
2
3
func main() {
  plugin.Start(new(BasicPlugin))
}

CopyEnv Plugin

Cloud Foundry CLI plugin to export application VCAP_SERVICES onto the local machine.

Applications running on Cloud Foundry rely on the VCAP_SERVICES environment variable to provide service credentials.

When running applications locally for development and testing, it’s useful to have the same VCAP_SERVICES values available in the local environment to simulate running on the host platform.

This plugin will export the remote application environment variables, available using cf env, into a format that makes it simple to expose those same values locally.

Modifying the Sample Plugin

For the new plugin, we will need to get an application name from the user, access the remote VCAP_SERVICES environment variable and then export this into the user’s local environment.

Accessing an application’s environment variables can be retrieved using the existing cf env command. The “plugin.CliConnection” reference passed into the Run function has methods for executing CLI commands from within the plugin.

We’re following the convention of the “cf env” command by having the application name as a command line argument. This means we can modify the existing “args” value to set up the CLI command to retrieve the VCAP_SERVICES value.

1
2
3
4
5
6
7
8
func (c *CopyEnv) Run(cliConnection plugin.CliConnection, args []string) {
  if len(args) < 2 {
    fmt.Println("ERROR: Missing application name")
     os.Exit(1)
  }

  args[0] = "env"
  output, err := cliConnection.CliCommandWithoutTerminalOutput(args...)

Now we have an array of strings, output, containing the text output from cf env APP_NAME command. Iterating through this list, we search for the line which contains the VCAP_SERVICES definition. This value will be a JSON object with a VCAP_SERVICES attribute defining the service credentials.

Exporting this JSON object to the local environment, we need to convert the VCAP_SERVICES object into a shell environment variable definition. Go has built in support for the JSON language. We decode the parent JSON to a Map interface and then export the VCAP_SERVICES attribute as JSON. This text is then wrapped within a shell variable definition.

1
2
3
4
5
6
7
8
9
10
11
12
13
14
15
16
17
18
19
20
for _, val := range output {
  if (strings.Contains(val, "VCAP_SERVICES")) {
    var f interface{}
    err := json.Unmarshal([]byte(val), &f)
    if err != nil {
      fmt.Println(err)
      os.Exit(1)
    }

    m := f.(map[string]interface{})
    b, err := json.Marshal(m["VCAP_SERVICES"])
    if err != nil {
      fmt.Println(err)
      os.Exit(1)
    }

    vcap_services := "export VCAP_SERVICES='" + string(b[:]) + "';"
    fmt.Println(vcap_services)
  }
}

Once we’ve finished the code, install the compiled binary using the CF CLI.

1
2
$ go build copyenv.go
$ cf install-plugin copyenv

Making plugin available for other users

Exporting out plugin into an external Git repository will allow users to use the Go package manager to retrieve and compile the plugin for installation with the CF CLI.

1
2
$ go get github.com/sample_user/sample_plugin
$ cf install-plugin $GOPATH/bin/sample_plugin

We can also include the plugin in the official Cloud Foundry Plugin Repository by forking the source project, adding their plugin definition to the repo-index.yml file and submitting a pull request.

For maximum compatibility, plugin authors are encouraged to include platform binaries for their plugins.

Go makes it extremely easy to cross-compile your source code for different platforms.

On Mac OS X, if you used Brew to install Go, you can set up cross-compilation with the following commands:

1
2
$ brew reinstall go --with-cc-common
$ GOOS=windows GOARCH=386 go build appname.go

For the full list of supported platforms, see the Go documentation

Using the Plugin

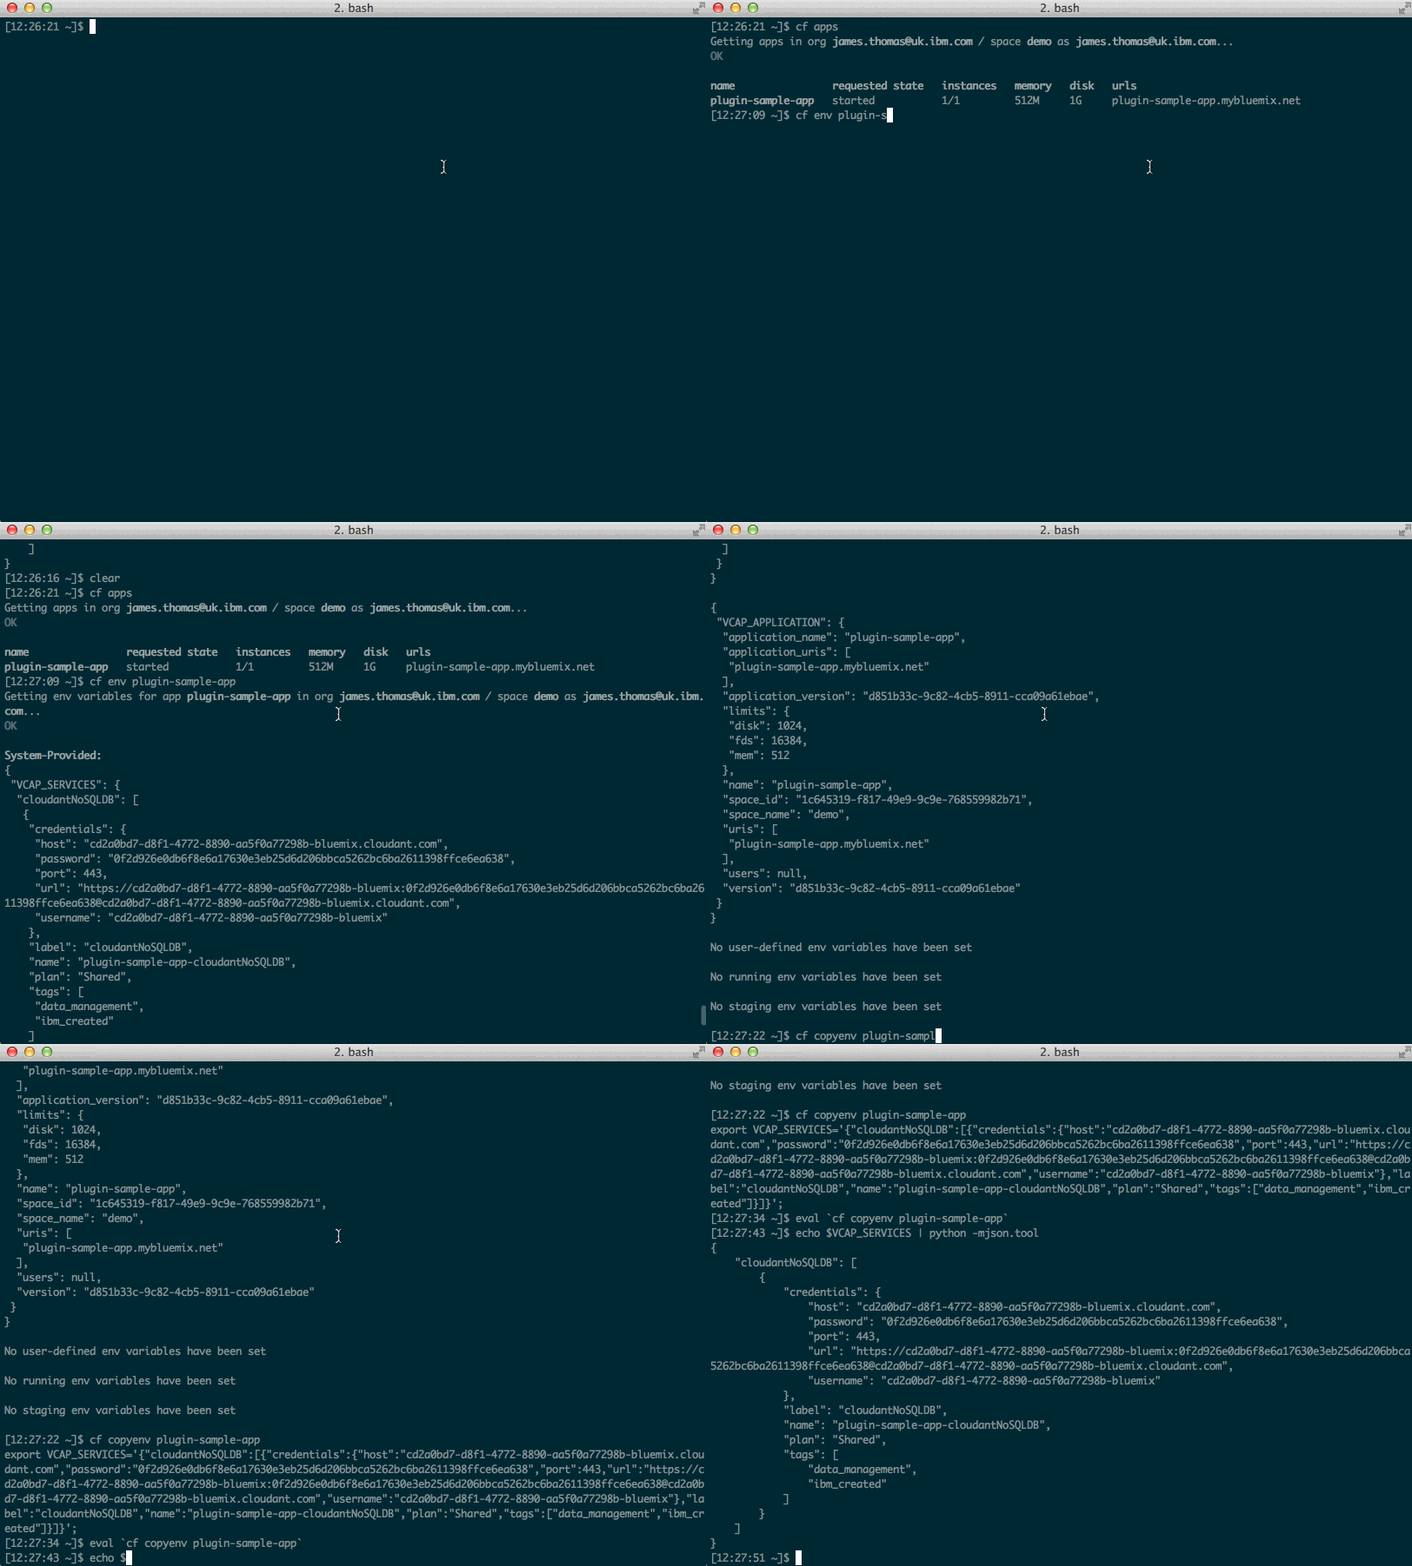
With the CopyEnv plugin installed, we can now run the following command to export an application’s VCAP_SERVICES into our local environment.

1
2
$ cf copyenv APP_NAME
export VCAP_SERVICES='{...}';

Writing a new plugin for the CF CLI was extremely straightforward. It’s a great feature to that enables people to contribute new plugins with minimal effort. I’m looking forward to seeing what plugins the community comes up with!

You can see the plugin in action below…

Cloud Foundry Custom Buildpacks

Cloud Foundry Buildpacks provide runtime and framework support for applications. Users can rely on the built-in selection for Java, NodeJS, Python, etc. or additional community buildpacks from Github.

Buildpacks are open-source, making them simple to customise and include libraries needed by your application.

Doctor Watson uses an NPM module that relies on a command-line application, SOX, being installed in the runtime environment.

Making this command-line application available on the platform required the project to create a custom NodeJS buildpack.

This was the first time I’ve needed to create a custom buildpack. Documenting the steps below will hopefully provide a guide for other people wanting to do the same.

Overall, the process was straightforward and left me with a greater understanding of how buildpacks works.

SOX Audio Processing Library

We’re using the SOX package within Doctor Watson to up-sample an audio file. This module depends on the command-line SOX audio processing utility being installed and available on the command line. SOX is an open-source C application.

Buildpack Internals

Cloud Foundry Buildpacks are Git repositories which must contain three shell scripts under the “bin” directory.

  • detect - Does this buildpack apply to this application?
  • compile - Build the runtime used to execute the application
  • release - Controls how the application should be executed

These shell scripts can be modified to perform any task necessary for an application runtime.

We’re starting with the default NodeJS buildpack.

The “bin/compile” script installs the correct NodeJS version, NPM modules and sets up the runtime environment to start the application. When the script is ran, a command line argument will give a directory path to place files needed at runtime.

We will need to install the SOX binary and dependent libraries under this directory path.

One method for doing this would be downloading the SOX source code and compiling during deployment, before installing the created binaries into the correct location.

Unfortunately, compiling from source during each deployment would add an unacceptable delay.

Therefore, most buildpacks use pre-built binaries, which are downloaded and moved to the build directory during deployment, saving a huge amount of time.

Creating the pre-built binary archive

Rather than manually creating our binaries from source, we can pull them from the Ubuntu package manager which already maintains a pre-built set of binaries for the SOX package.

Packaging the binary and any dynamic libraries dependencies into an archive file, this can be stored in the buildpack repository for extraction during deployment.

We need to ensure the pre-built binaries were compiled for the same host environment that Cloud Foundry will use to run our application.

Using the cf stacks command, we can see the platforms details.

1
2
3
4
5
6
7
8
[13:51:45 ~]$ cf stacks
Getting stacks in org james.thomas@uk.ibm.com / space dev as james.thomas@uk.ibm.com...
OK

name      description
lucid64   Ubuntu 10.04
seDEA     private
[13:53:10 ~]$

Now we just need access to the same platform to run the package manager on…

Docker to the rescue!

Using Docker

We’re going to use Docker to run a new container with the same operating system as the Cloud Foundry environment. Using this we can install the SOX package using ‘apt-get’ and extract all the installed files.

1
2
3
4
5
6
7
8
9
10
11
12
13
14
15
16
17
18
19
20
21
[13:56:46 ~]$ docker run -t -i  ubuntu:10.04 /bin/bash
root@7fdb1e9047e1:/#
root@7fdb1e9047e1:/# apt-get install sox
root@7fdb1e9047e1:/# which sox
/usr/bin/sox
root@7fdb1e9047e1:/# ldd /usr/bin/sox
    linux-vdso.so.1 =>  (0x00007fff2819f000)
    libsox.so.1 => /usr/lib/libsox.so.1 (0x00007f0f32a94000)
    libltdl.so.7 => /usr/lib/libltdl.so.7 (0x00007f0f3288a000)
    libdl.so.2 => /lib/libdl.so.2 (0x00007f0f32685000)
    libpng12.so.0 => /lib/libpng12.so.0 (0x00007f0f3245e000)
    libmagic.so.1 => /usr/lib/libmagic.so.1 (0x00007f0f32242000)
    libz.so.1 => /lib/libz.so.1 (0x00007f0f3202a000)
    libgomp.so.1 => /usr/lib/libgomp.so.1 (0x00007f0f31e1c000)
    libgsm.so.1 => /usr/lib/libgsm.so.1 (0x00007f0f31c0e000)
    libm.so.6 => /lib/libm.so.6 (0x00007f0f3198a000)
    libpthread.so.0 => /lib/libpthread.so.0 (0x00007f0f3176d000)
    libc.so.6 => /lib/libc.so.6 (0x00007f0f313eb000)
    /lib64/ld-linux-x86-64.so.2 (0x00007f0f32d28000)
    librt.so.1 => /lib/librt.so.1 (0x00007f0f311e2000)
root@7fdb1e9047e1:/#

Now we have the location of the SOX binary along with a list of the dynamic libraries it depends on.

How do we know which of those libraries were already available in the operating system and those the package manager installed?

Using Docker diff, we can compare the container to the base image.

1
2
3
4
5
6
7
8
9
10
11
12
[14:02:43 ~]$ docker diff 7fdb1e9047e1 | grep '\.so\.'
C /etc/ld.so.cache
C /etc/ld.so.conf.d
A /etc/ld.so.conf.d/libasound2.conf
C /lib/libgcc_s.so.1
A /usr/lib/libFLAC.so.8
A /usr/lib/libFLAC.so.8.2.0
A /usr/lib/libasound.so.2
A /usr/lib/libasound.so.2.0.0
A /usr/lib/libgomp.so.1
A /usr/lib/libgomp.so.1.0.0
....

This command will output list of files that have been modified. Grepping this for the list of dependencies we have, it’s easy to extract those which are new.

We can now copy the files needed from the container filesystem to our local host and bundle into an archive in the “vendor” directory.

1
[14:02:43 ~]$ docker cp 7fdb1e9047e1:/usr/bin/sox .

Modifying the “bin/compile” script

With the pre-built binary package available in the buildpack repository, we just need to extract this during deployment from the vendor directory into the build directory.

Modifying the PATH and LD_LIBRARY_PATH variables will expose the binary during runtime and ensure the dynamic libraries are recognised.

1
2
3
4
5
6
7
8
9
# Add SOX binary and libraries to path
status "Adding SOX library support"
tar xzf $bp_dir/vendor/sox.tar.gz -C $build_dir/vendor/

# Update the PATH
status "Building runtime environment"
mkdir -p $build_dir/.profile.d
echo "export PATH=\"\$HOME/vendor/node/bin:\$HOME/bin:\$HOME/node_modules/.bin:\$HOME/vendor/:\$PATH\";" > $build_dir/.profile.d/nodejs.sh
echo "export LD_LIBRARY_PATH=\"\$HOME/vendor/libs/\";" >> $build_dir/.profile.d/nodejs.sh

Using the custom buildpack

Once the buildpack modifications have been committed to the external Github repository, the application manifest can be modified to point to this new location.

---
applications:
- name: doctor-watson
  memory: 256M 
  buildpack: https://github.com/jthomas/nodejs-buildpack.git
  command: node app.js
  services:
  - twilio
  - speech_to_text
  - question_and_answer

… at this point all we have to do is deploy our application again to take advantage of the modified runtime.

Conclusion

Buildpacks are a fantastic feature of the Cloud Foundry, allowing the platform to support for almost any runtime. Using open-source Git repositories means you can build on any existing buildpack.

For Doctor Watson, we were able to add a command line binary, built in another language, to the NodeJS runtime. Docker was a great tool when developing our custom buildpack.

If you want more information on customising buildpacks, check out the Cloud Foundary documentation.

Source code for the custom buildpack we created is available here.