
This blog post is the final part of a series on “Monitoring Serverless Applications Metrics”. See the introduction post for details and links to other posts.
In previous blog posts, we showed how to capture serverless metrics from IBM Cloud Functions, send those values into the IBM Cloud Monitoring service and build visualisation dashboards using Grafana.
Dashboards are a great way to monitor metrics but rely on someone watching them! We need a way to be alerted to issues without having to manually review dashboards.
Fortunately, IBM Cloud Monitoring service comes with an automatic alerting mechanism. Users configure rules that define metrics to monitor and expected values. When values fall outside normal ranges, alerts are sent using installed notification methods.
Let’s finish off this series on monitoring serverless applications by setting up a sample alert notification monitoring errors from our serverless applications…
Alerting in IBM Cloud Monitoring
IBM Cloud Monitoring service supports defining custom monitoring alerts. Users define rules to identify metric values to monitor and expected values. Alerts are triggered when metric values fall outside thresholds. Notification methods including email, webhooks and PagerDuty are supported.
Let’s set up a sample monitoring alert for IBM Cloud Functions applications.
We want to be notified when actions start to return error codes, rather than successful responses. The monitoring library already records boolean values for error responses from each invocation.
Creating monitoring alerts needs us to use the IBM Cloud Monitoring API.
Using the IBM Cloud Monitoring API needs authentication credentials and a space domain identifier. In a previous blog post, we showed how to retrieve these values.
Monitoring Rules API
Monitoring rules can be registered by sending a HTTP POST request to the /alert/rule endpoint.
Configuration parameters are included in the JSON body. This includes the metric query, threshold values and monitoring time window. Rules are connected to notification methods using notification identifiers.
This is an example rule configuration for monitoring errors from IBM Cloud Function applications.
{
  "name": "ibm_cloud_functions",
  "description": "Monitor errors from all actions",
  "expression": "sumSeries(ibm.public.cloud-functions.<region>.<namespace>.*.*.error)",
  "enabled": true,
  "from": "-5min",
  "until": "now",
  "comparison": "above",
  "comparison_scope": "last",
  "error_level" : 10,
  "warning_level" : 1,
  "frequency": "1min",
  "dashboard_url": "https://metrics.ng.bluemix.net",
  "notifications": [
    "email_alert"
  ]
}
The expression parameter defines the query used to monitor values.
sumSeries(ibm.public.cloud-functions.<region>.<namespace>.*.*.error)
Error metric values use 0 for normal responses and 1 for errors. sumSeries adds up all error values recorded within the monitoring window.
Using a wildcard for the sixth field means all actions are monitored. Replacing this field value with an action name will restrict monitoring to just that action. Region and namespace templates need substituting with actual values for your application.
Threshold values for triggering alerts are defined using the warning_level and error_level parameters. Warning messages are triggered after a single action failure and error messages after ten failures.
Notification identifiers, registered using the API, are provided in the notifications field. Rules may include more than one notification identifiers.
Notifications API
Notifications can be registered by sending a HTTP POST request to the /alert/notification endpoint. Configuration parameters are included in the JSON body.
This is an example configuration for email notifications.
{
	"name": "email_alert",
	"type": "Email",
	"description" : "Email alerting notifications",
	"detail": "email@address.com"
}
Notifications are configured using the type parameter in the body. Valid values for this field include Email, Webhook or PagerDuty. The detail field is used to include the email address, webhook endpoint or PagerDuty API key. The name field is used to reference this notification method when setting up rules.
Setting up alerts for serverless errors
Creating an email notification
- Create the
notify.jsonfile from the template above.
$ cat notify.json
{
  "name": "email_alert",
  "type": "Email",
  "description" : "Email alerting notifications",
  "detail": "your_email@address.com"
}
- Send the following HTTP request using
curl. Include scope and auth token values in the headers.
$ curl --request POST \
    --url https://metrics.ng.bluemix.net/v1/alert/notification \
    --header 'x-auth-scope-id: s-<YOUR_DOMAIN_SPACE_ID>' \
    --header 'x-auth-user-token: apikey <YOUR_API_KEY>' \
    --data @notify.json
{
  "status": 200,
  "message": "Created notification 'email_alert'"
}
Testing email notification
- Sending the following HTTP request using
curlto generate a test email.
$ curl --request POST \
    --url https://metrics.ng.bluemix.net/v1/alert/notification/test/email_alert \
    --header 'x-auth-scope-id: s-<YOUR_DOMAIN_SPACE_ID>' \
    --header 'x-auth-user-token: apikey <YOUR_API_KEY>'
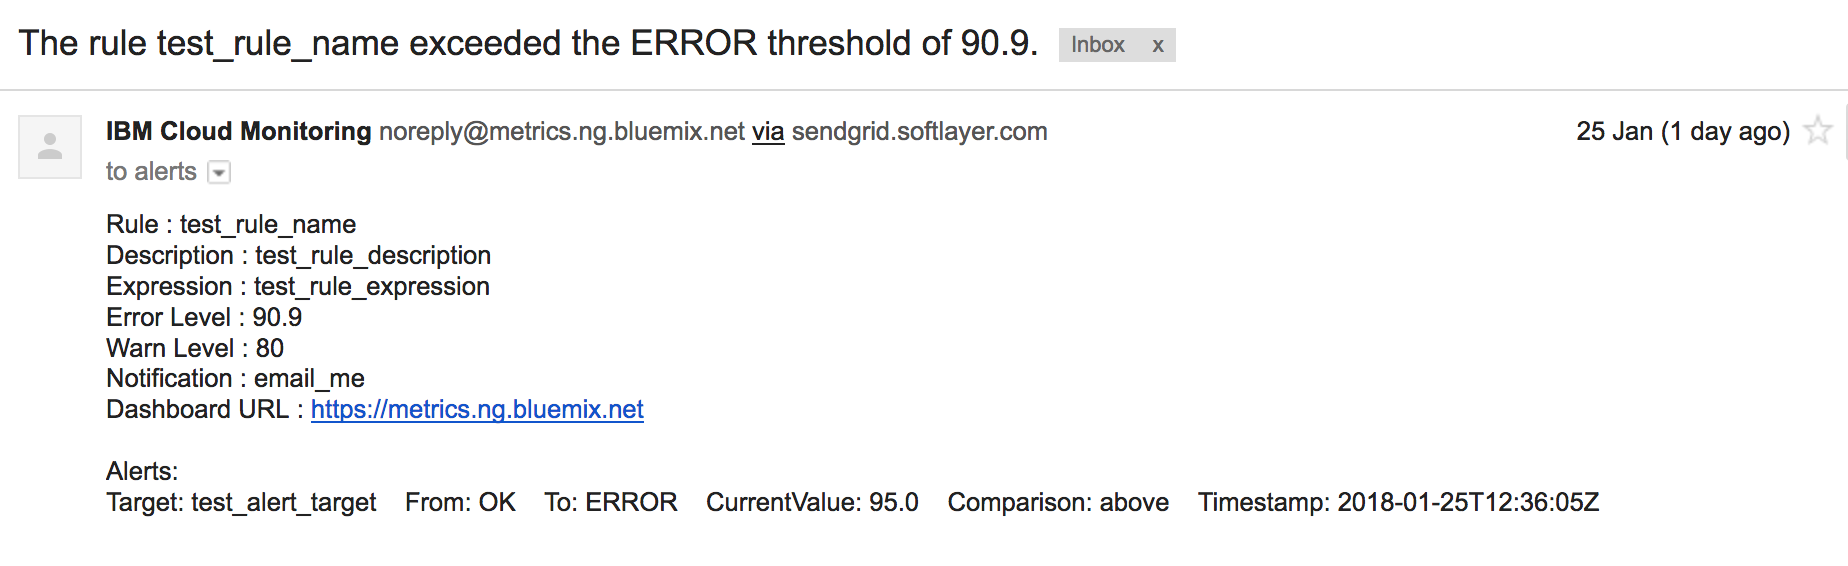
- This returns the test notification message which will be emailed to the address.
{
    "status": 200,
    "message": "Triggered test for notification 'email_alert'",
    "content": {
      "rule_name": "test_rule_name",
      "description": "test_rule_description",
      "notification_name": "email_alert",
      "scope_id": "s-<YOUR_DOMAIN_SPACE_ID>",
      "expression": "test_rule_expression",
      "warning_level": "80",
      "error_level": "90.9",
      "dashboard_url": "https://metrics.ng.bluemix.net",
      "alert_messages": [
        {
          "target": "test_alert_target",
          "from_type": "OK",
          "to_type": "ERROR",
          "current_value": "95.0",
          "comparison": "above",
          "timestamp": "2018-01-25T12:36:05Z"
        }
      ]
    }
}
- Check the email inbox to verify the message has arrived.
Create monitoring rule for errors
-
Create the
rule.jsonfile from the template above, replacingregionandnamespacevalues. -
Send the following HTTP request using
curl. Include scope and auth token values in the headers.
$ curl --request POST --url https://metrics.ng.bluemix.net/v1/alert/rule \
    --header 'x-auth-scope-id: s-<YOUR_DOMAIN_SPACE_ID>' \
    --header 'x-auth-user-token: apikey <YOUR_API_KEY>' \
    --data @rule.json
{
  "status": 200,
  "message": "Created rule 'ibm_cloud_functions'"
}
Testing alerts for serverless errors
Let’s generate some errors in a sample action to check the monitoring rule works.
Create failing action
- Create a new Node.js library called “fails”.
$ mkdir fails && cd fails && npm init
- Install the
openwhisk-metricslibrary.
$ npm install openwhisk-metrics
- Edit the
index.jsfile to have the following source code.
const metrics = require('openwhisk-metrics')

const main = params => {
  return { error: 'Oh dear, this action failed...' }
}

exports.main = metrics(main)
- Deploy the code as an OpenWhisk action.
$ zip -r action.zip *
  adding: index.js (deflated 22%)
  ...
$ bx wsk action create fails action.zip --kind nodejs:8
ok: created action fails
- Invoke the action. Check the activation response is an error.
$ bx wsk action invoke fails -b
ok: invoked /_/fails with id cbee42f77c6543c6ae42f77c6583c6a7
{
  "activationId": "cbee42f77c6543c6ae42f77c6583c6a7",
  "response": {
    "result": {
      "error": "Oh dear, this action failed..."
    },
    "status": "application error",
    "success": false
  },
  ...
}
response.result.success should be false.
- Update
actionsparameter for themetric-forwarderaction to include thefailsaction name.
$ cat params.json
{
  "actions": ["fails"],
  "service": {
    "api_key": "<API_KEY>",
    "host": "metrics.ng.bluemix.net",
    "scope": "s-<SPACE_ID>"
  },
  "since": 1516894777975
}
$ wsk action update metric-forwarder -P params.json
Generate serverless errors
Invoking the fails action should now trigger an email notification. Let’s test this out and trace metrics values through the platform.
- Fire an action invocation using the CLI.
$ wsk action invoke fails -b
bx wsk action invoke fails -b
ok: invoked /_/fails with id 524b27044fd84b6a8b27044fd84b6ad8
...
- Review the activation logs to show the error metric was recorded.
$ wsk activation logs 524b27044fd84b6a8b27044fd84b6ad8
...
stdout: METRIC <namespace>.fails.524b27044fd84b6a8b27044fd84b6ad8.error 1 1516895270
- Invoke the
metric-forwarderaction to push metric values into the IBM Cloud Monitoring service.
$ bx wsk action invoke metric-forwarder -b
ok: invoked /_/metric-forwarder with id 295c47f05ea042849c47f05ea08284f0
- Review activation logs to verify metric values were retrieved.
$ bx wsk activation logs 295c47f05ea042849c47f05ea08284f0
2018-01-25T15:51:47.160135346Z stdout: actions being monitored: [ 'fails' ]
2018-01-25T15:51:47.160177305Z stdout: retrieving logs since: 1516894777975
2018-01-25T15:51:47.290529179Z stdout: found 11 metric values from 1 activations
2018-01-25T15:51:47.291234046Z stdout: saving to metrics service -> metrics.ng.bluemix.net
2018-01-25T15:51:48.232790321Z stdout: saving metrics to service took: 941.169ms
2018-01-25T15:51:48.233334982Z stdout: updating since parameter: 1516895270458
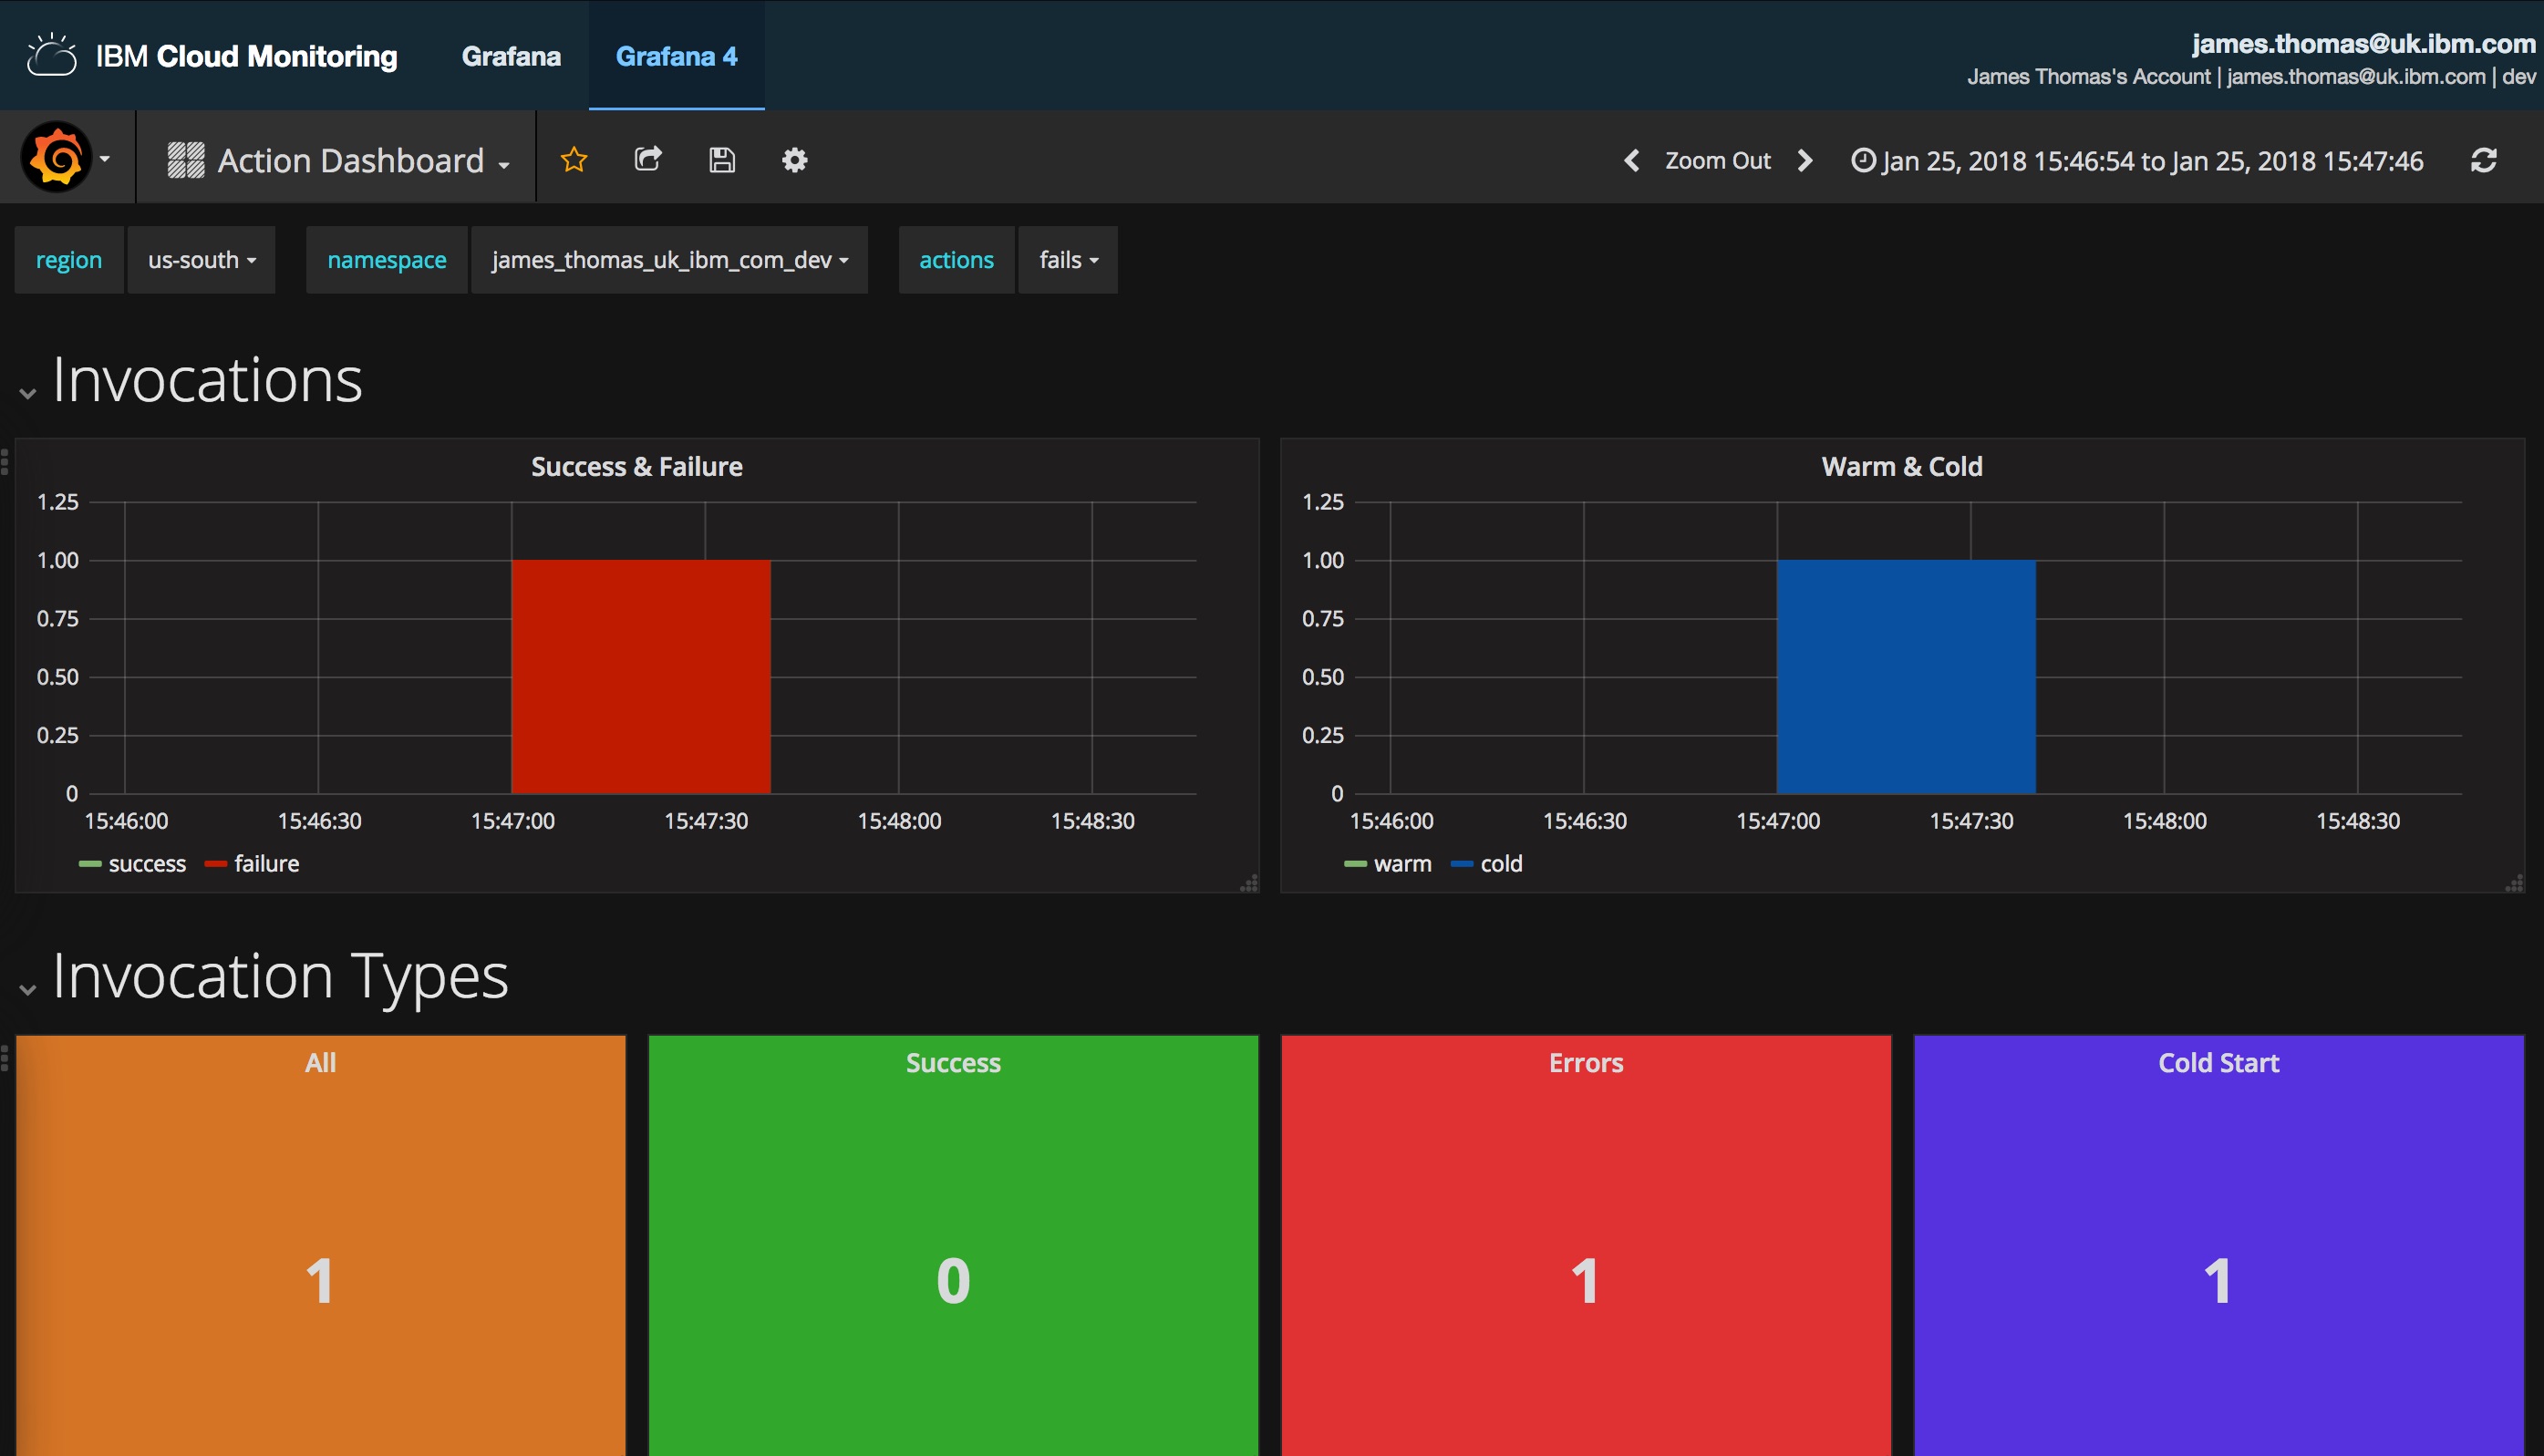
- Use the IBM Cloud Monitoring dashboard to show the error has been recorded.
- Check your email inbox for the message showing the error notification!
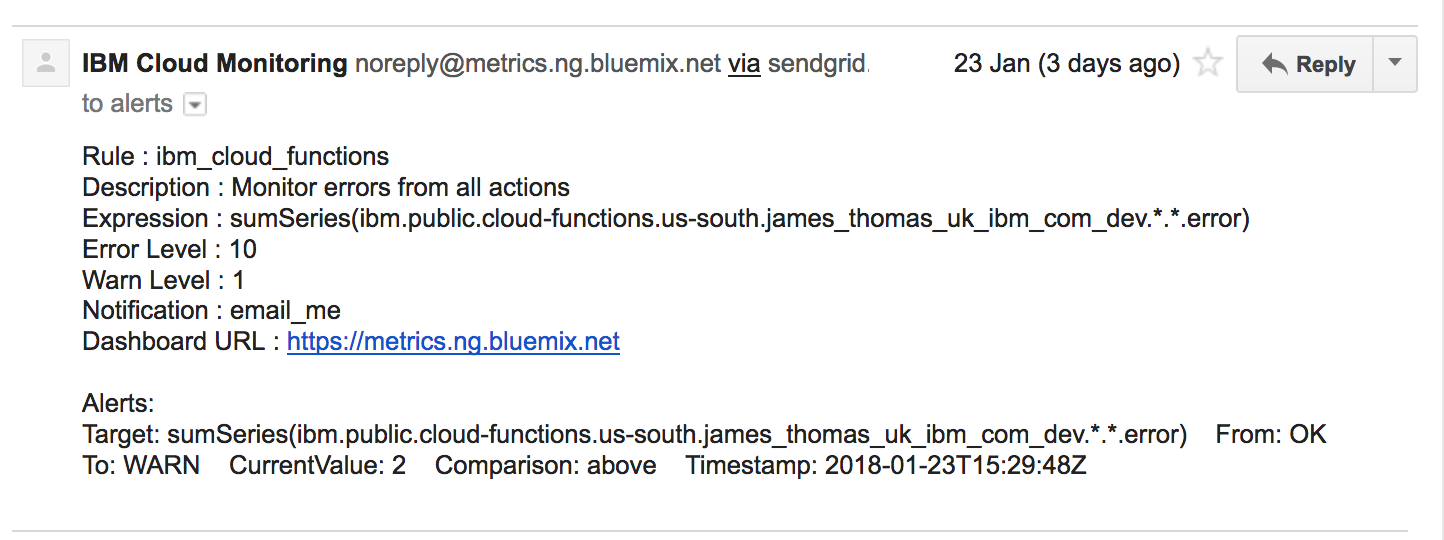
- Using the Cloud Monitoring API, we can retrieve the notification history to show this message was sent.
$ curl --request POST --url https://metrics.ng.bluemix.net/v1/alert/history \
    --header 'x-auth-scope-id: s-<YOUR_DOMAIN_SPACE_ID>' \
    --header 'x-auth-user-token: apikey <YOUR_API_KEY>'
[
  {
    "from_level": "OK",
    "metric_name": "sumSeries(ibm.public.cloud-functions.<region>.<namespace>.*.*.error)",
    "notification_names": [
      "email_alert"
    ],
    "rule_name": "ibm_cloud_functions",
    "timestamp": "2018-01-23T15:29:48Z",
    "to_level": "WARN",
    "value": 1
  }
]
Invoking the fails action more than ten times will trigger a second alert when the rule moves from warning to error thresholds.
Conclusion
IBM Cloud Monitoring service supports sending notification alerts based upon application metric values. Configuring notifications rules, based upon our serverless metrics, ensures we will be alerted immediately when issues occur with our serverless applications. Notifications can be sent over email, webhooks or using PagerDuty.
In this series on “Monitoring Serverless Application Metrics”, we have shown you how to monitor serverless applications using IBM Cloud. Starting with capturing runtime metrics from IBM Cloud Functions, we then showed how to forward metrics into the IBM Cloud Monitoring service. Once metric values were being recorded, visualisation dashboards were built to help diagnose and resolve application issues. Finally, we configured automatic alerting rules to notify us over email as soon as issues developed.
Serverless applications are not “No Ops”, but “Different Ops”. Monitoring runtime metrics is still crucial. IBM Cloud provides a comprehensive set of tools for monitoring cloud applications. Utilising these services, you can create a robust monitoring solution for IBM Cloud Functions applications.